Fig. 13.
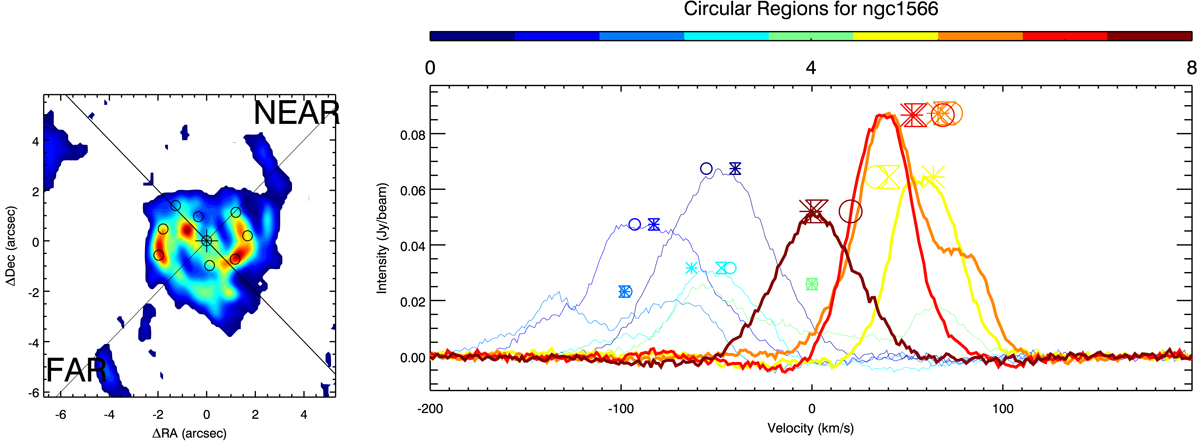
CO spectral profiles in apertures along the inner spiral arms. Left panel: location of each circular aperture (![]() in radius) overlaid on the CO flux map. For reference, the center of the galaxy, major axis, and the near and far sides of the disk, are indicated. Apertures are numbered 0–8 with aperture 0 being the farthest aperture on the E arm, aperture 4 the nuclear one, and aperture 8 the farthest aperture on the W arm. Right panel: extracted CO J:2-1 spectra; thick lines are used for the spectra corresponding to apertures from the W arm (Apertures 5–8), and different colors are used for each spectrum, following the color bar on top of the panel. Symbols with the corresponding color (plotted at the y value of the peak flux density of the spectrum) denote the radial velocities expected in that aperture for our rotation model (hourglasses), our outflows + rotation model (asterisks), and our rotation plus radial streaming inflow model (open circles). In some apertures, adding outflows and/or streaming inflows does not change the predicted radial velocity; this is a result of projection effects and/or the fact that our outflow model has zero velocity beyond ∼2″ from the nucleus.
in radius) overlaid on the CO flux map. For reference, the center of the galaxy, major axis, and the near and far sides of the disk, are indicated. Apertures are numbered 0–8 with aperture 0 being the farthest aperture on the E arm, aperture 4 the nuclear one, and aperture 8 the farthest aperture on the W arm. Right panel: extracted CO J:2-1 spectra; thick lines are used for the spectra corresponding to apertures from the W arm (Apertures 5–8), and different colors are used for each spectrum, following the color bar on top of the panel. Symbols with the corresponding color (plotted at the y value of the peak flux density of the spectrum) denote the radial velocities expected in that aperture for our rotation model (hourglasses), our outflows + rotation model (asterisks), and our rotation plus radial streaming inflow model (open circles). In some apertures, adding outflows and/or streaming inflows does not change the predicted radial velocity; this is a result of projection effects and/or the fact that our outflow model has zero velocity beyond ∼2″ from the nucleus.
Current usage metrics show cumulative count of Article Views (full-text article views including HTML views, PDF and ePub downloads, according to the available data) and Abstracts Views on Vision4Press platform.
Data correspond to usage on the plateform after 2015. The current usage metrics is available 48-96 hours after online publication and is updated daily on week days.
Initial download of the metrics may take a while.