Fig. 12.
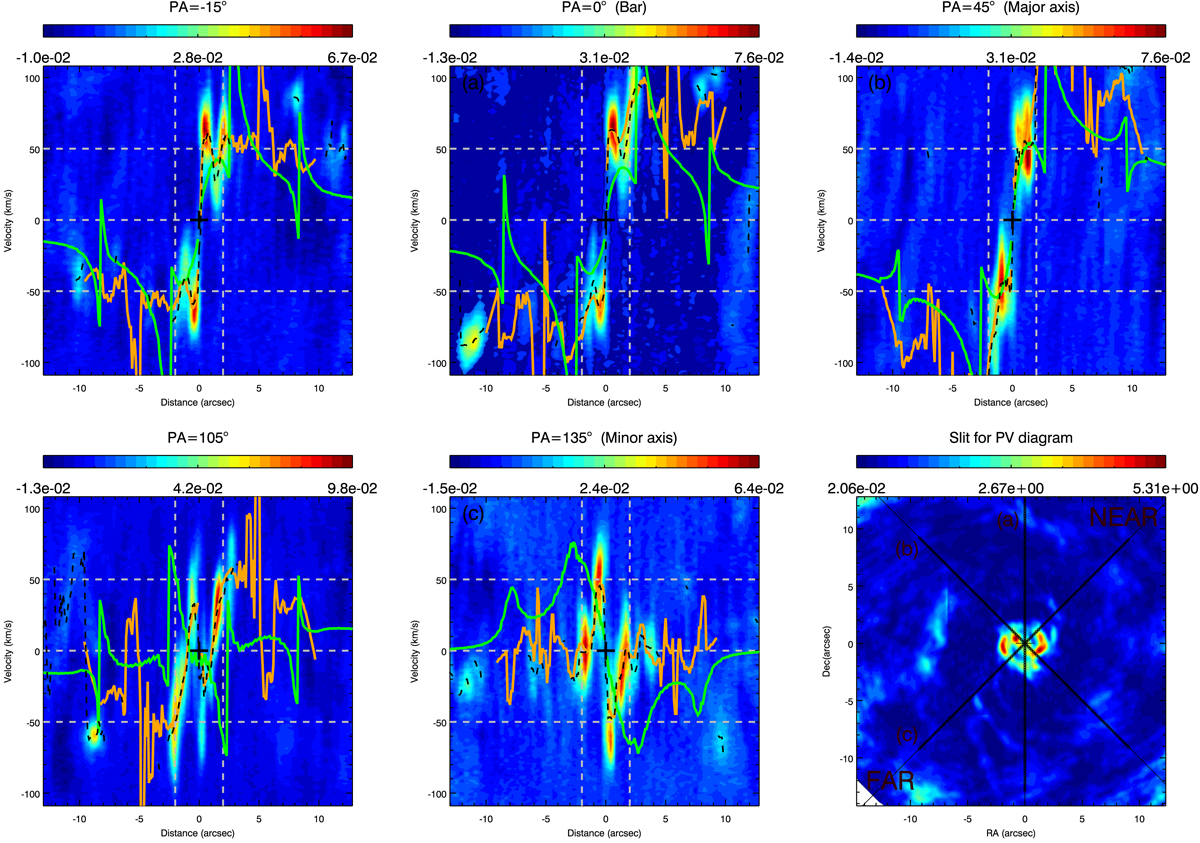
Position-velocity diagrams, as in Fig. 9, but here the overplotted lines show the velocity of the corresponding pixel in the CO moment 1 map (dashed black lines; i.e., the flux-weighted average velocity at a given pixel), the best-fit velocity field from Diskfit (solid orange line), and for comparison the λ = 0.2 and Ω = 120 km s−1 kpc model from our linear perturbation analysis (bottom right panel of Fig. 10; solid green line). To better trace the highest velocity components in the CO moment 1 (velocity) map, we used a cutoff of 8 mJy beam−1 per channel (∼4σ) to create the moment 1 map which is overplotted here and used as the input map to Diskfit. The PA of the “slit” along which the pv diagram was extracted is marked above each panel. Bottom right panel: the moment 0 map of CO J:2-1 together with the positions of the slits used to create the pv-diagrams in the upper row panels.
Current usage metrics show cumulative count of Article Views (full-text article views including HTML views, PDF and ePub downloads, according to the available data) and Abstracts Views on Vision4Press platform.
Data correspond to usage on the plateform after 2015. The current usage metrics is available 48-96 hours after online publication and is updated daily on week days.
Initial download of the metrics may take a while.