Fig. 9
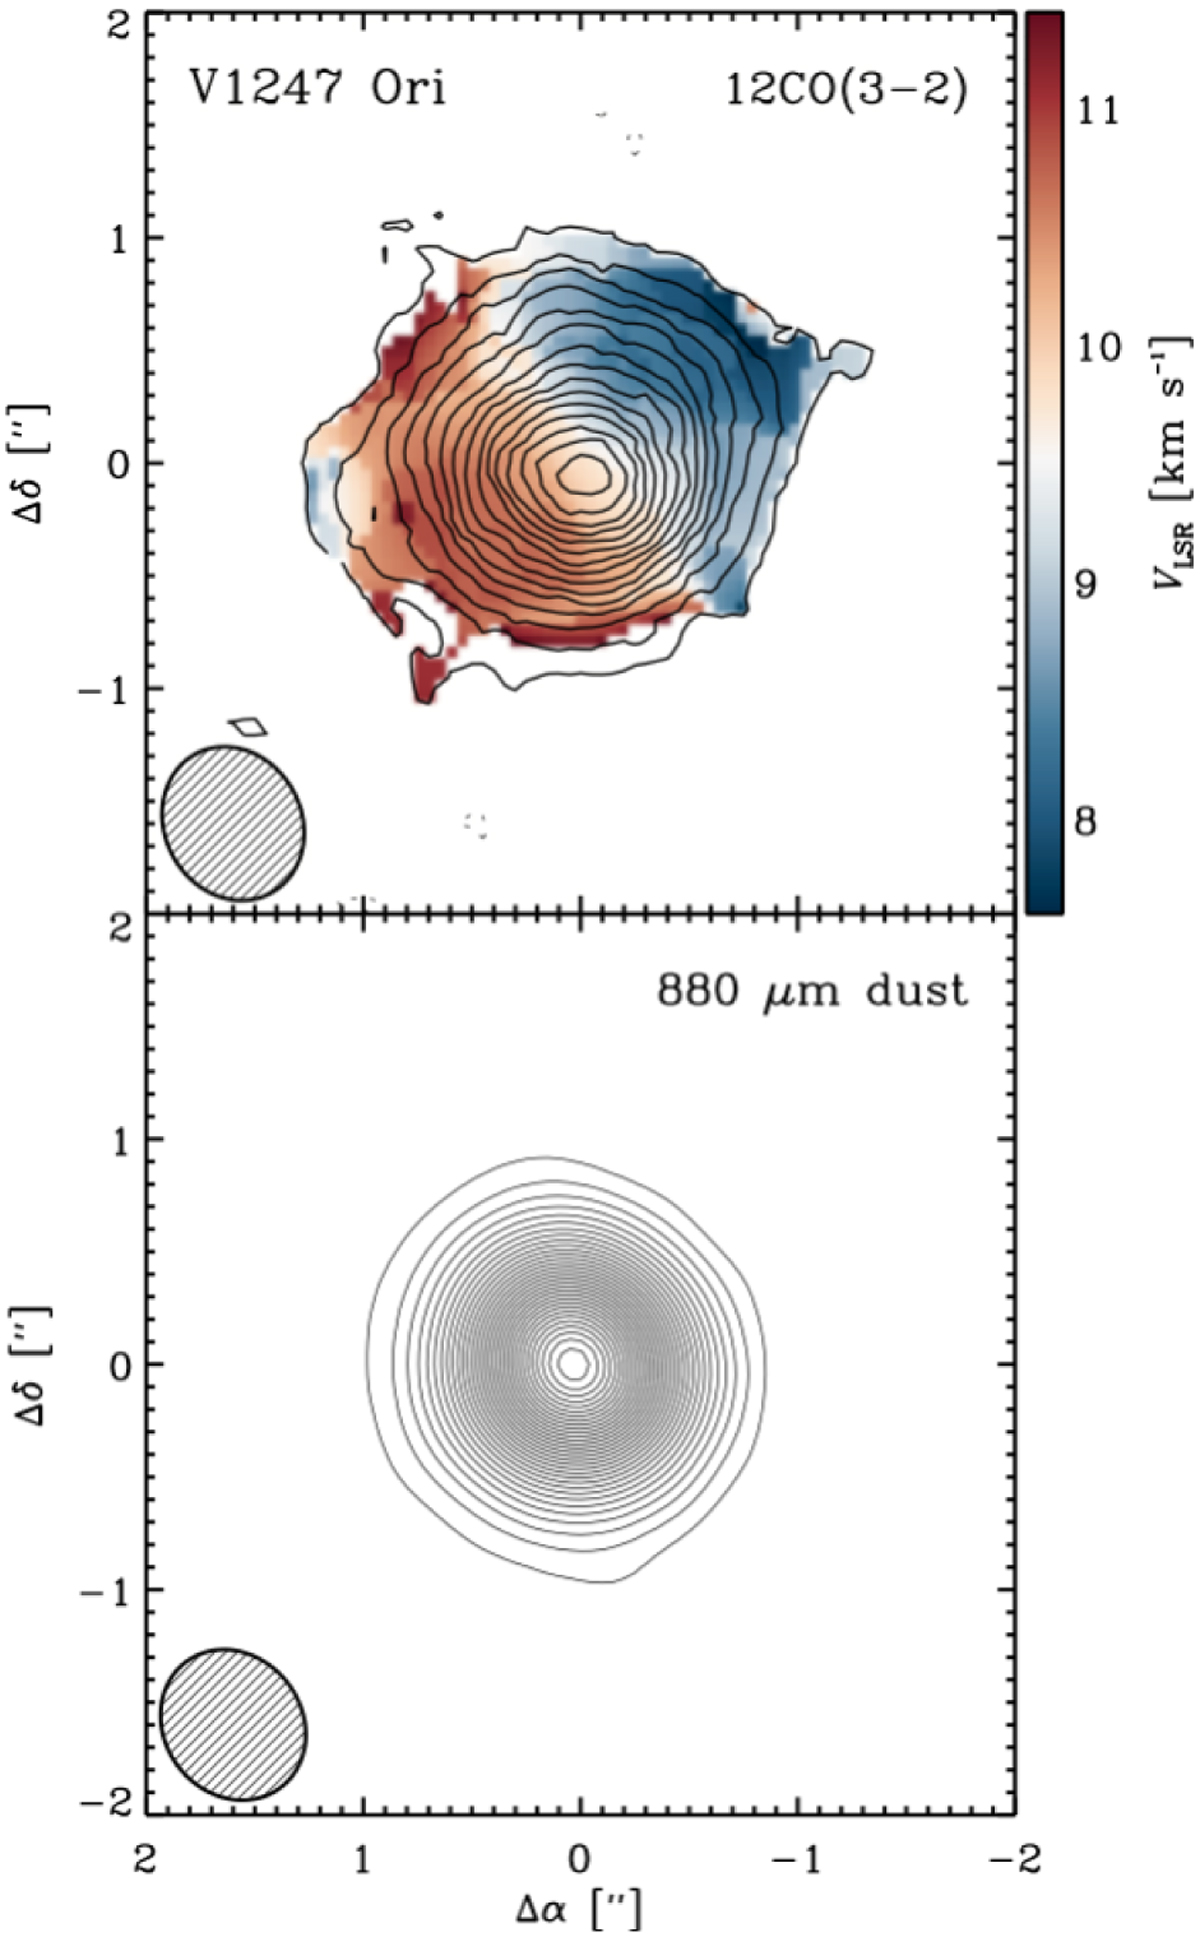
Top panel: synthesised 4.′′0× 4.′′ 0 map of the CO J = 3 − 2 integrated intensity from the disc around V1247 Ori (contours increase at 150 mJy km s−1 beam−1 intervals) overlaid on the intensity-weighted velocities (colour scale; to show sense of rotation). Bottom panel: synthesised 4.′′ 0× 4.′′ 0 880 μm continuum map. Contours increase at 4.25 mJy beam−1 intervals. The bottom left corners of each map show the synthesised beam dimensions.
Current usage metrics show cumulative count of Article Views (full-text article views including HTML views, PDF and ePub downloads, according to the available data) and Abstracts Views on Vision4Press platform.
Data correspond to usage on the plateform after 2015. The current usage metrics is available 48-96 hours after online publication and is updated daily on week days.
Initial download of the metrics may take a while.