Fig. 7
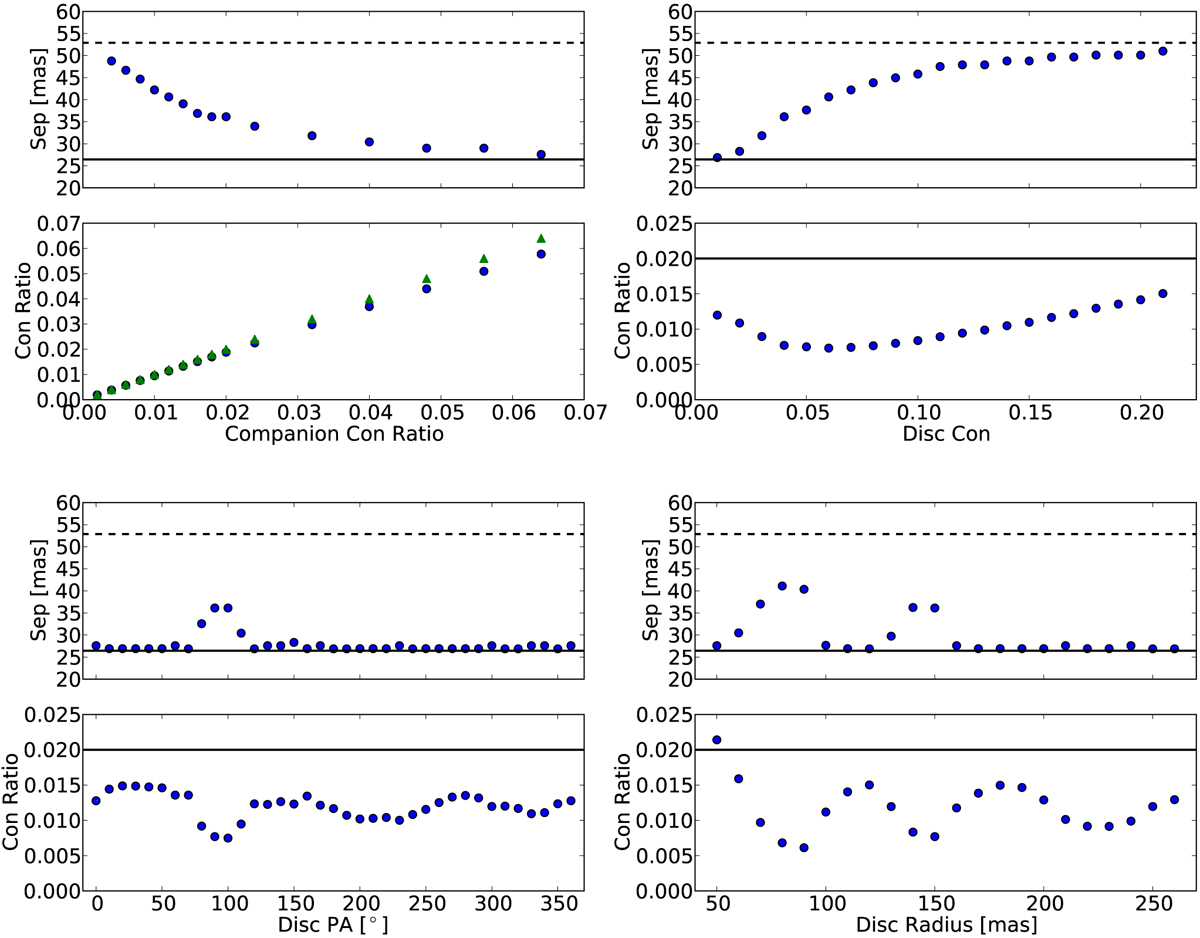
Simulated data sets to investigate the effect on the position and contrast ratio of a point source at 20 mas. Each contains an upper and a lower panel displaying how the fitted separation (upper) and contrast ratio (lower) depends upon different disc parameters. Top left panel: varying point source contrast ratio (model – blue circles, best fit – green triangles). Top right panel: varying disc contrast, fdisc ∕ftotal. Bottom left panel: varying disc major-axis position angle. Bottom right panel: disc semi-major axis. In the upper panels, the dashed and solid black lines represent λ ∕B and λ ∕2B resolution limits of the uv-plane, respectively. λ∕2B (~26 mas) represents the minimum separation for which we search for a companion. Within the lower panels, the solid black line represents the true contrast ratio of the point source in the absence of a disc. We never find a point source at this contrast ratio as a result of the minimum separation limits we place on the fitting routine. At smaller separations the algorithm struggles to find a minimum in the χ2. We find that the separation is over estimated in cases where the position angle of the point source and of the disc semi-major axis are approximately orthogonal and where the disc radius is such to produce an enhancement to the closure phase signal at short baselines.
Current usage metrics show cumulative count of Article Views (full-text article views including HTML views, PDF and ePub downloads, according to the available data) and Abstracts Views on Vision4Press platform.
Data correspond to usage on the plateform after 2015. The current usage metrics is available 48-96 hours after online publication and is updated daily on week days.
Initial download of the metrics may take a while.