Fig. 5
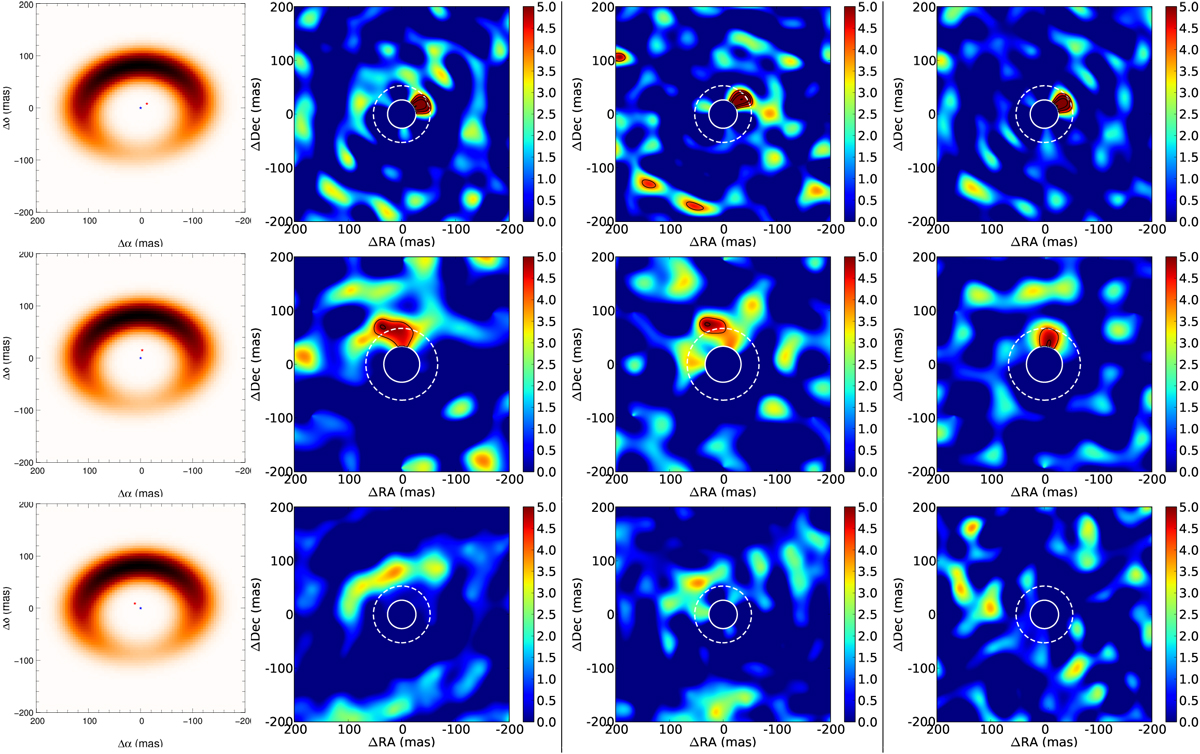
A comparison of significance maps for a number of models of the environment around V1247 Ori. First column: input model used to calculate model closure phases, while second column: resulting significance maps from the disc+companion model data sets. Third column: real SAM data obtained for V1247 Ori SAM. Finally, we show results of a binary fit from a companion-only model (fourth column). The different rows show the three epochs covered by our observations, namely 2012-01-09 (top row), 2012-12-18 (middle row), and 2013-10-20 (bottom row). The significance maps for the simulated data sets are normalised for the strongest detection to be the same as in the corresponding real data set. The disc+companion models (first and second columns) reproduce the measured data (third column) more readily than companion-only scenario (fourth column). The dashed and solid circlescorrespond to the sample resolution limits described for the degeneracy plots, where the dashed line is λ ∕B and the solidline is λ∕2B approximately defining the region under which the contrast ratio and separation of a point source are less well constrained. The significance map colour bars show the significance of the binary fit to the data at each pixel location (σ).
Current usage metrics show cumulative count of Article Views (full-text article views including HTML views, PDF and ePub downloads, according to the available data) and Abstracts Views on Vision4Press platform.
Data correspond to usage on the plateform after 2015. The current usage metrics is available 48-96 hours after online publication and is updated daily on week days.
Initial download of the metrics may take a while.