Fig. 4
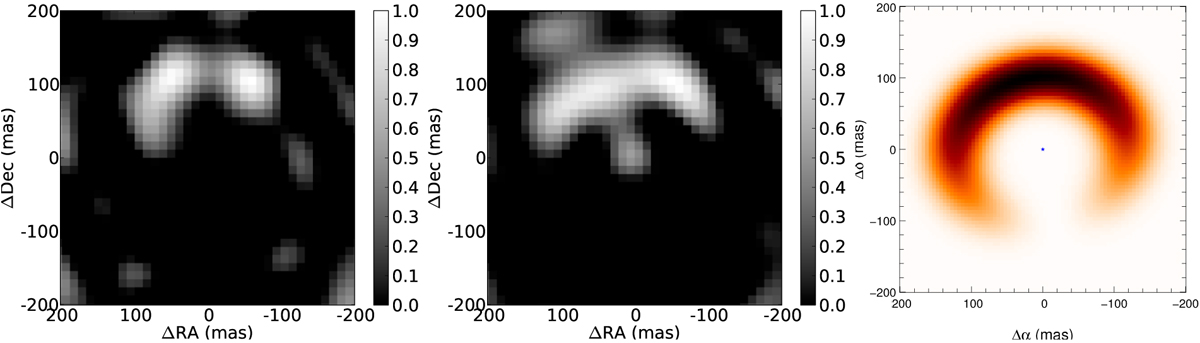
Combined L′-band SAM observations. From left to right panels: reconstructed image from the combined data set of all three L-band data sets, reconstructed image from the best fit geometric model using the uv-coverage from the combined data set, and finally the geometric model used. The improved uv-coverage creates an image with improved fidelity. The disc rim is clearly resolved with the artefacts substantially reduced. We find the total unresolved flux fraction to be 0.95 located centrally which is removed from the reconstructed images to allow betterinspection of the resolved structures. The colour scale in the images refers to the flux as a fraction of the peak flux after subtracting the central source.
Current usage metrics show cumulative count of Article Views (full-text article views including HTML views, PDF and ePub downloads, according to the available data) and Abstracts Views on Vision4Press platform.
Data correspond to usage on the plateform after 2015. The current usage metrics is available 48-96 hours after online publication and is updated daily on week days.
Initial download of the metrics may take a while.