Fig. 3
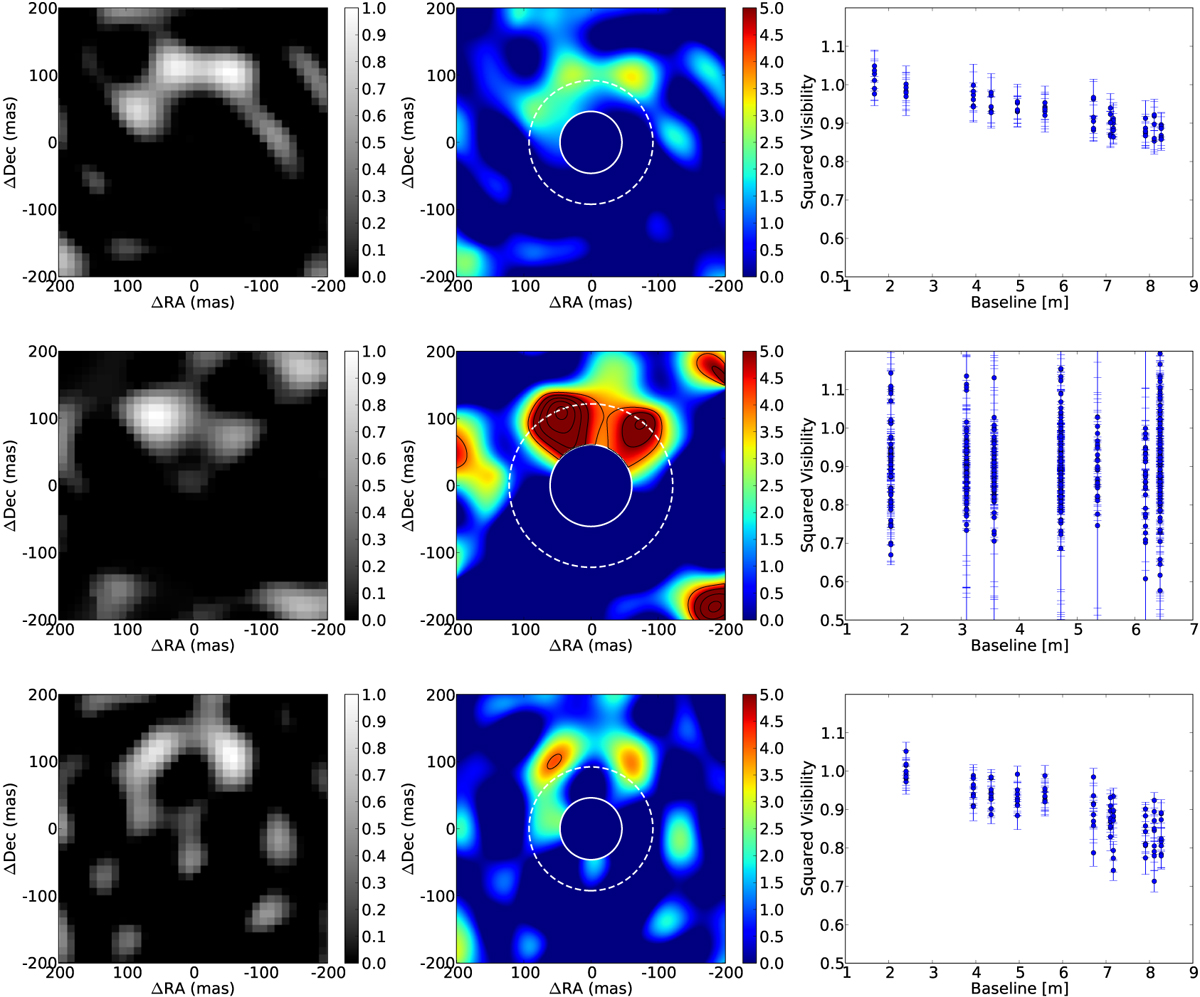
L′-band observations and the combined observations. Left panels: reconstructed images. Middle panels: computed significance map. Right panels: squared visibilities. First row: 2012-01-10. Second row: 2012-12-18. Third row: 2013-11-16. We interpret thestructures seen in all three epochs as caused by an illuminated disc rim. The colour bars in the reconstructed images indicate the flux contained in each pixel as a fraction of the peak flux in the image after subtracting the central source. The colour bars in the significance maps represent significance of the binary fit to the data at each pixel location (σ).
Current usage metrics show cumulative count of Article Views (full-text article views including HTML views, PDF and ePub downloads, according to the available data) and Abstracts Views on Vision4Press platform.
Data correspond to usage on the plateform after 2015. The current usage metrics is available 48-96 hours after online publication and is updated daily on week days.
Initial download of the metrics may take a while.