Fig. 2
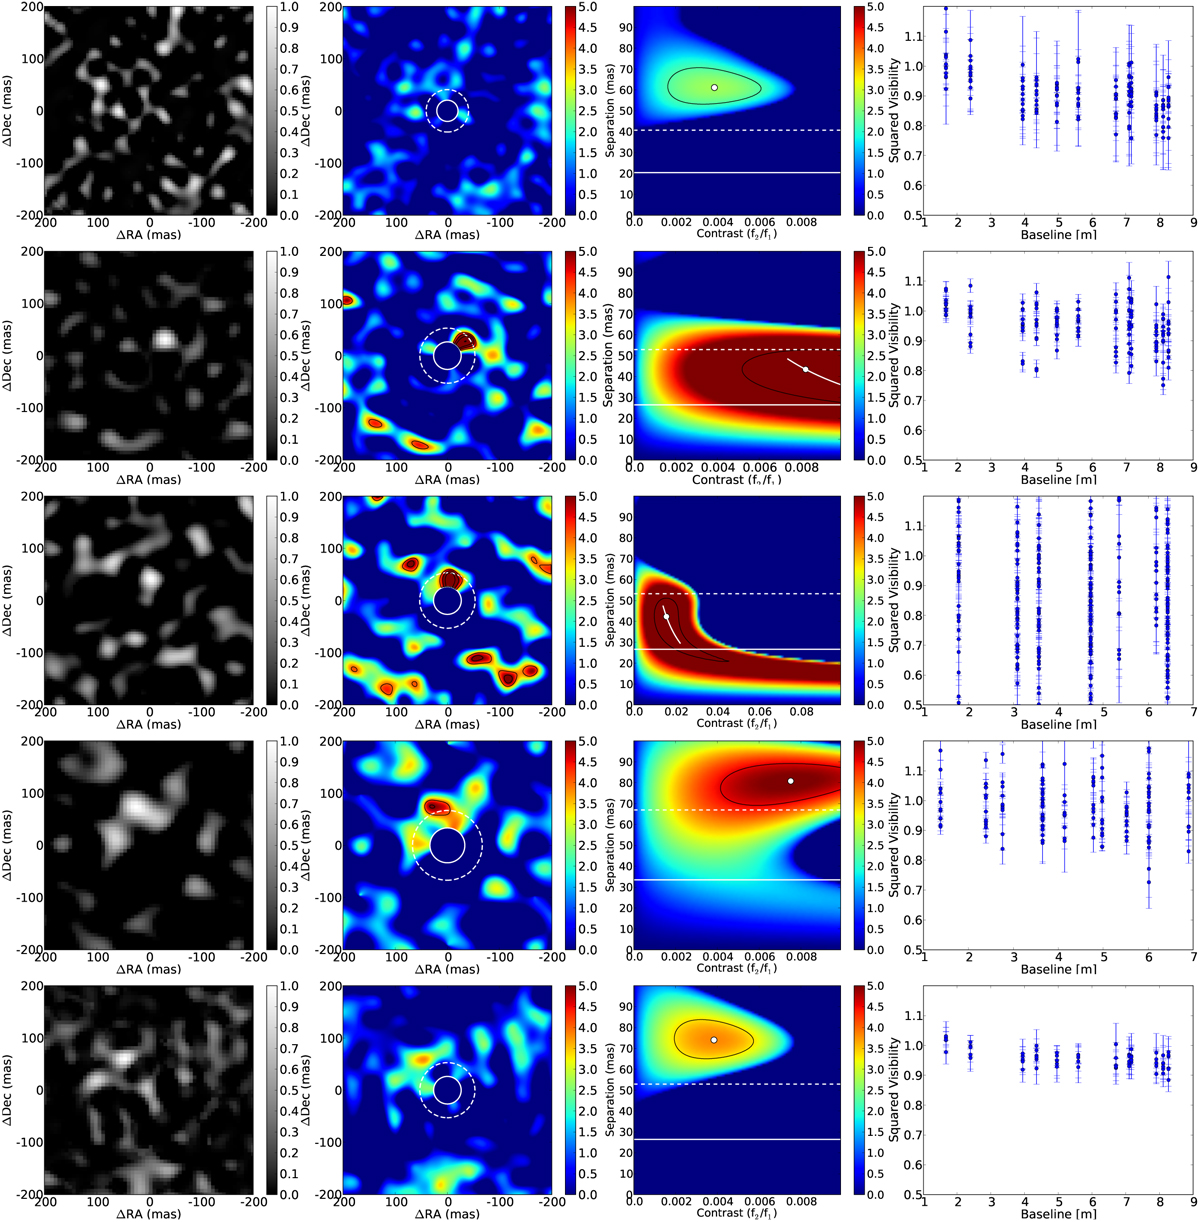
H- and K-band observations where we see significant structure. Left panels: reconstructed images. Middle left panels: computed significance maps. Middle right panels: degeneracy plots. Right panels: squared visibilities. First row: 2012-01-10, H-band. Second row: 2012-01-09, K′-band. Third row: 2012-12-18, H-band. Fourth row: 2012-12-18, Ks-band. Fifth row: 2013-10-20, K′-band. The 2012-01-09 K-band data (second row) shows a companion candidate north-west of the star, which appears to have moved to north by 2012-12-18 (H-band data set, third row). This motion appears to be too rapid for Keplerian motion of a companion at the estimated (~ 45 mas) separation. In Sect. 5.1.4, we interpret this is due to a separation overestimation caused by the presence of scattering from the outer disc rim. The dashed and solid white lines within the degeneracy plots represent separations corresponding to λ ∕B and λ ∕2B, where B is the longest baseline of the array. The black contours represent the region of Δ σ = 1 around thebest-fit value. Colour bars in the reconstructed images represent flux as a fraction of the peak flux within the frame after subtracting the central source while those in the significance maps represent significance (σ) of the binary fit to the data at each pixel location.
Current usage metrics show cumulative count of Article Views (full-text article views including HTML views, PDF and ePub downloads, according to the available data) and Abstracts Views on Vision4Press platform.
Data correspond to usage on the plateform after 2015. The current usage metrics is available 48-96 hours after online publication and is updated daily on week days.
Initial download of the metrics may take a while.