Free Access
Fig. 9.
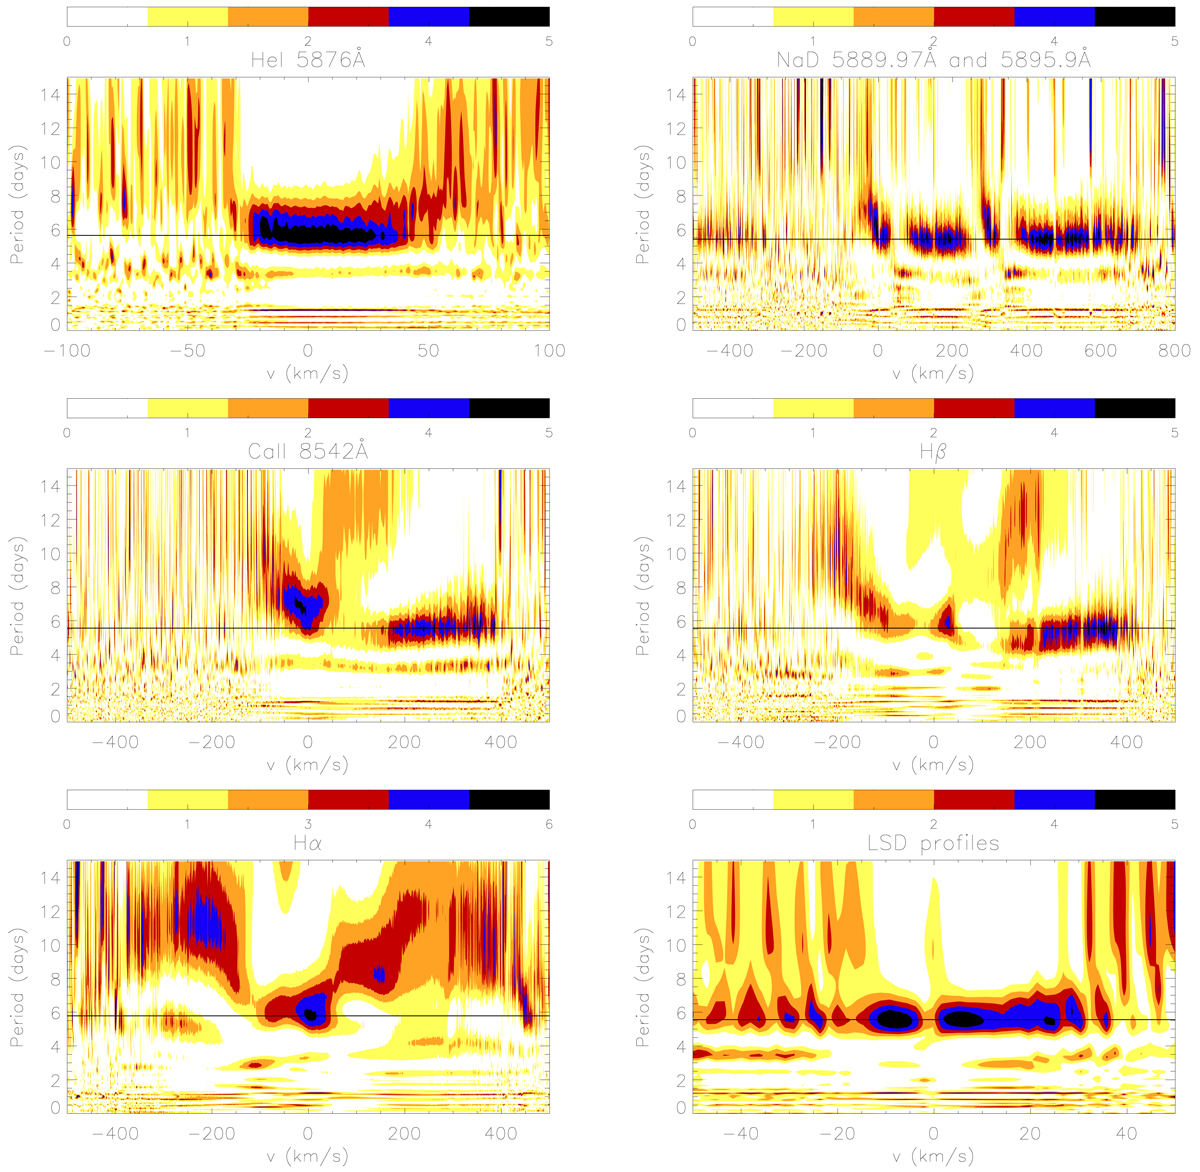
HeI 5876 Å NaD, CaII 8542 Å Hβ, Hα and LSD line periodograms. The top color bars represent the periodogram power, varying from zero (white) to the maximum power (black). The black horizontal lines correspond to the highest power period of each line, as discussed in the text.
Current usage metrics show cumulative count of Article Views (full-text article views including HTML views, PDF and ePub downloads, according to the available data) and Abstracts Views on Vision4Press platform.
Data correspond to usage on the plateform after 2015. The current usage metrics is available 48-96 hours after online publication and is updated daily on week days.
Initial download of the metrics may take a while.