Free Access
Fig. 19.
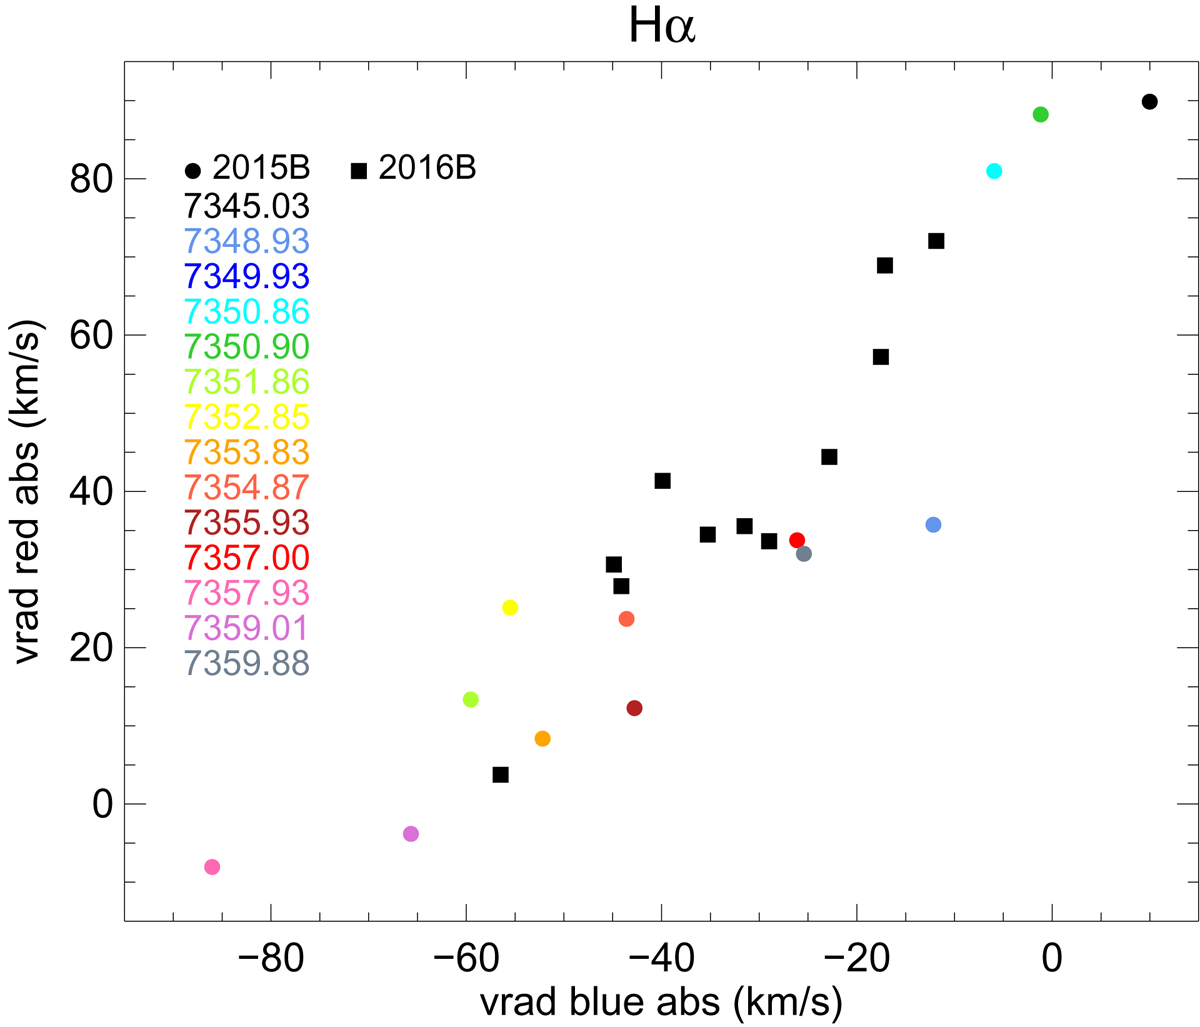
Hα blueshifted and redshifted radial velocity variability. Filled circles represent the 2015B data and filled squares the 2016B data. The observation dates of the 2015B run we analyzed here are shown with the same color code as the corresponding points.
Current usage metrics show cumulative count of Article Views (full-text article views including HTML views, PDF and ePub downloads, according to the available data) and Abstracts Views on Vision4Press platform.
Data correspond to usage on the plateform after 2015. The current usage metrics is available 48-96 hours after online publication and is updated daily on week days.
Initial download of the metrics may take a while.