Fig. 4.
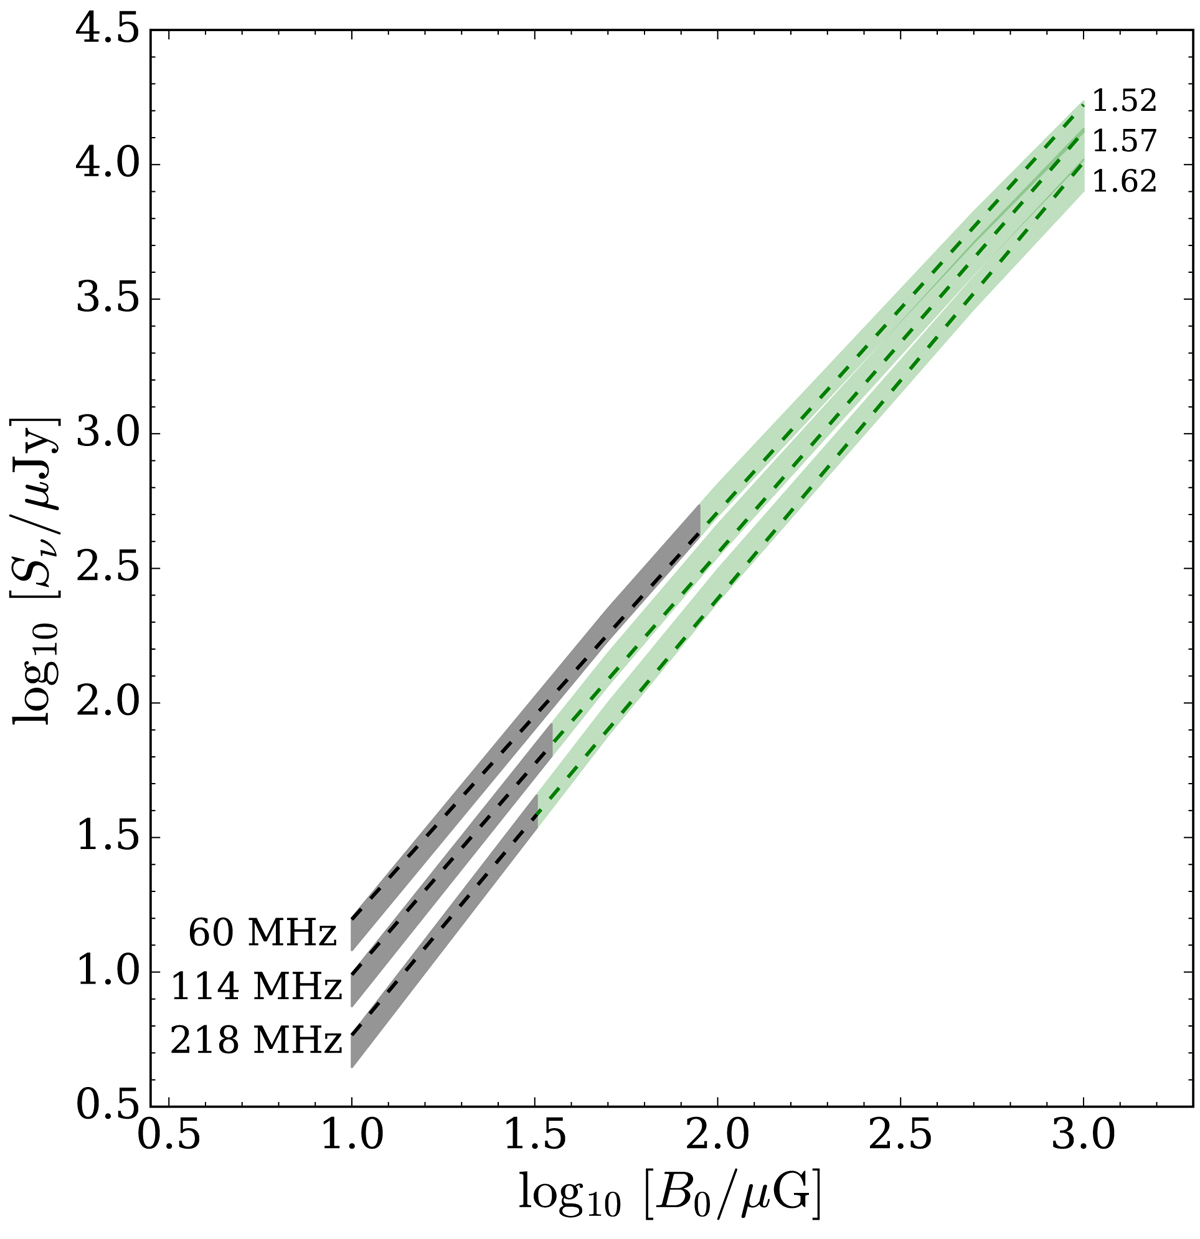
Flux density at 60, 114, and 218 MHz (lower-left labels) as a function of magnetic field strength B0 for model B (see Sect. 5.1). Green shaded areas encompass the curves obtained with Eq. (9) by using κ = 0.5 and 0.7. Grey areas correspond to S/N < 3 and dashed lines are power-law fits of ![]() with δ listed in the upper-right corner.
with δ listed in the upper-right corner.
Current usage metrics show cumulative count of Article Views (full-text article views including HTML views, PDF and ePub downloads, according to the available data) and Abstracts Views on Vision4Press platform.
Data correspond to usage on the plateform after 2015. The current usage metrics is available 48-96 hours after online publication and is updated daily on week days.
Initial download of the metrics may take a while.