Fig. 3.
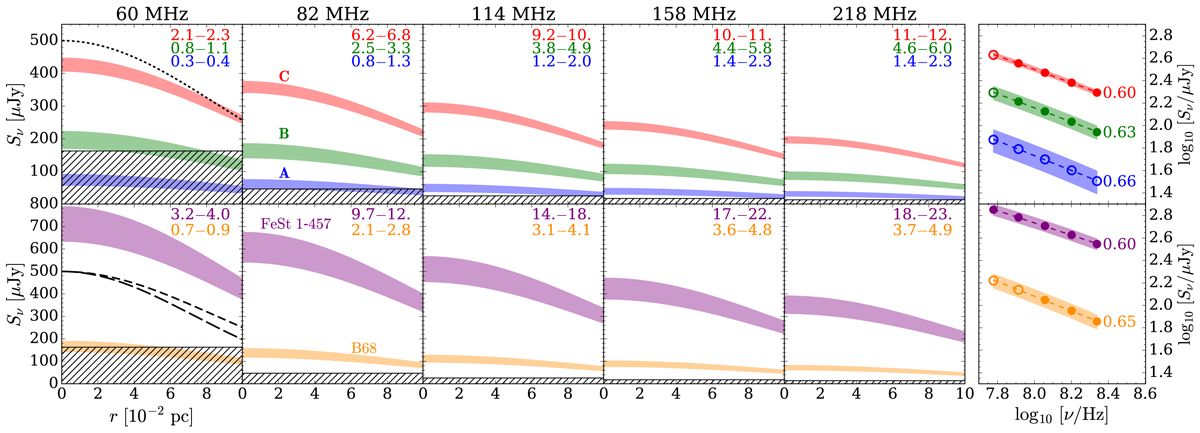
Radial flux density profiles for the starless core models described in Sect. 5.1 (upper row) and for B68 and FeSt 1-457 (lower row, see Sect. 5.2). The observing frequency is shown in black at the top of each column, while numbers in the upper-right corner of each subplot represent the radius-averaged S/N for the two values of κ (0.5 and 0.7 for models A, B, C and B68, and 0.68 and 0.88 for FeSt 1-457, see Eq. (9)). Shaded areas encompass the curves obtained with Eq. (9) by using the two values of κ (see Fig. 2 for colour-coding). The telescope beam is shown in the leftmost column for models A, B, and C (dotted black line, 300″), B68 (short-dashed black line, 330″), and FeSt 1-457 (long-dashed black line, 284″). Hatched areas display SKA sensitivities for one hour of integration at different frequencies. The two panels on the right side show the flux density as a function of frequency. Empty (solid) circles refer to a S/N smaller (larger) than 3, respectively. The spectral index α is shown on the right of each curve.
Current usage metrics show cumulative count of Article Views (full-text article views including HTML views, PDF and ePub downloads, according to the available data) and Abstracts Views on Vision4Press platform.
Data correspond to usage on the plateform after 2015. The current usage metrics is available 48-96 hours after online publication and is updated daily on week days.
Initial download of the metrics may take a while.