Fig. 2.
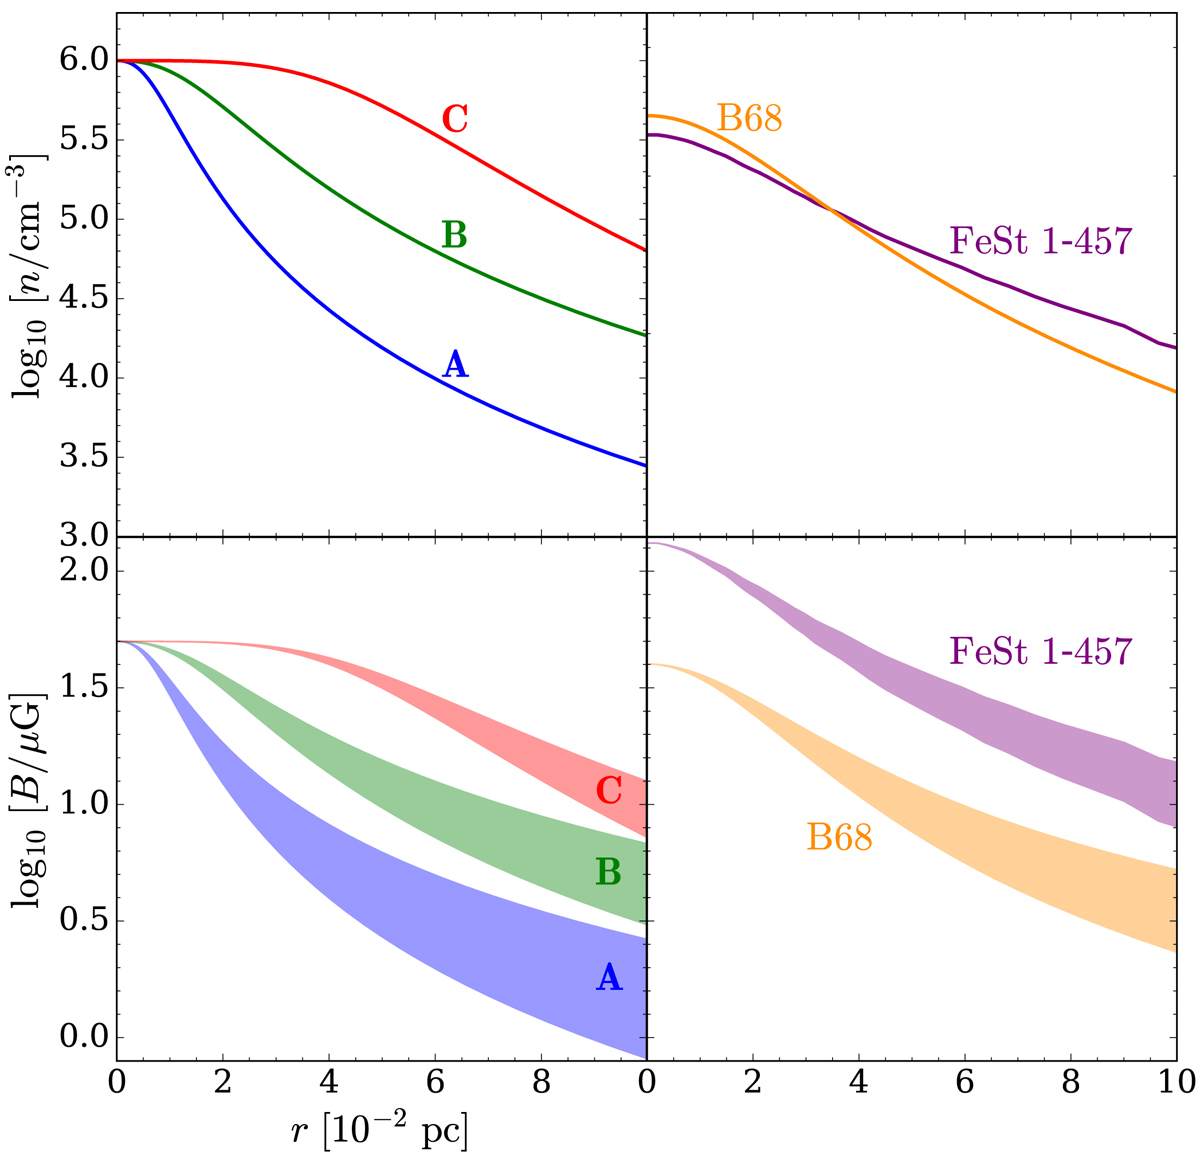
Density and magnetic field strength profiles as a function of radius (upper and lower panels, respectively). Left column: models of starless cores described by Eq. (8), r0 = 14″, q = 2.5 (model A, solid blue line), r0 = 30″, q = 2.5 (model B, solid green line), and r0 = 75″, q = 4 (model C, solid red line). Right column: starless cores FeSt 1-457 (purple) and B68 (orange). Shaded areas in the lower panels encompass the curves obtained with Eq. (9) using κ = 0.5 and 0.7 for models A, B, C and B68 and κ = 0.68 and 0.88 for FeSt 1-457 (upper and lower boundary, respectively).
Current usage metrics show cumulative count of Article Views (full-text article views including HTML views, PDF and ePub downloads, according to the available data) and Abstracts Views on Vision4Press platform.
Data correspond to usage on the plateform after 2015. The current usage metrics is available 48-96 hours after online publication and is updated daily on week days.
Initial download of the metrics may take a while.