Fig. 1.
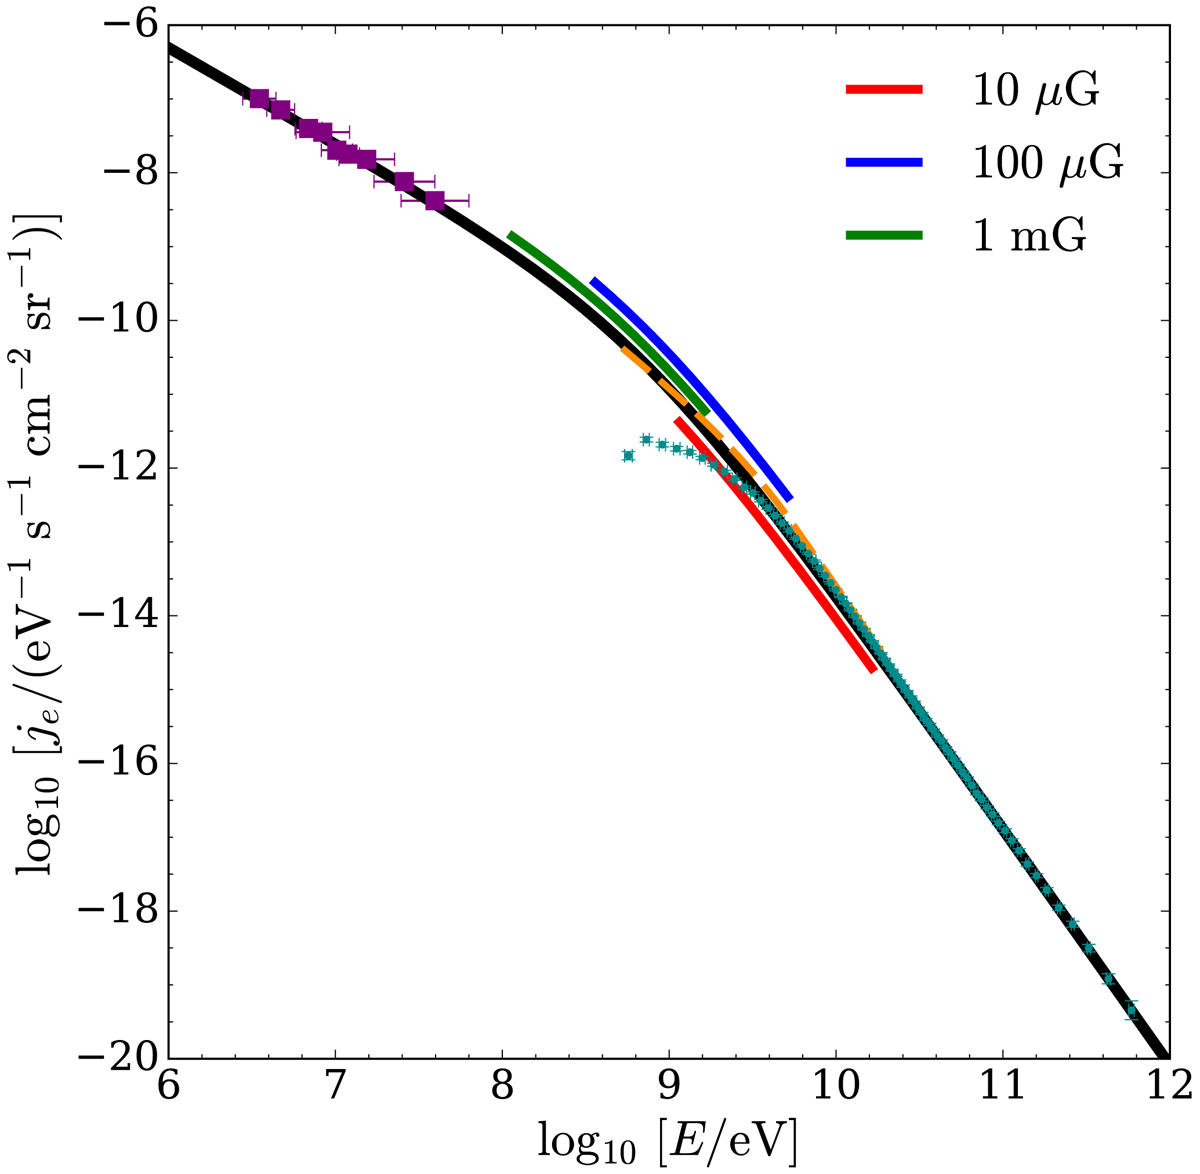
Flux of IS CR electrons (black solid line) as a function of energy. Data: Voyager 1 (Cummings et al. 2016, solid purple squares) at low energies, AMS-02 (Aguilar et al. 2014, solid cyan circles) at high energies. The red, blue, and green thick lines show the energy range that mostly contributes to synchrotron emission in the frequency range of SKA for the values of the magnetic field strength listed in the legend (see Eq. (7)). The orange dashed line shows the CR electron-positron flux obtained from Galactic synchrotron emission (Orlando 2018).
Current usage metrics show cumulative count of Article Views (full-text article views including HTML views, PDF and ePub downloads, according to the available data) and Abstracts Views on Vision4Press platform.
Data correspond to usage on the plateform after 2015. The current usage metrics is available 48-96 hours after online publication and is updated daily on week days.
Initial download of the metrics may take a while.