Fig. 3.
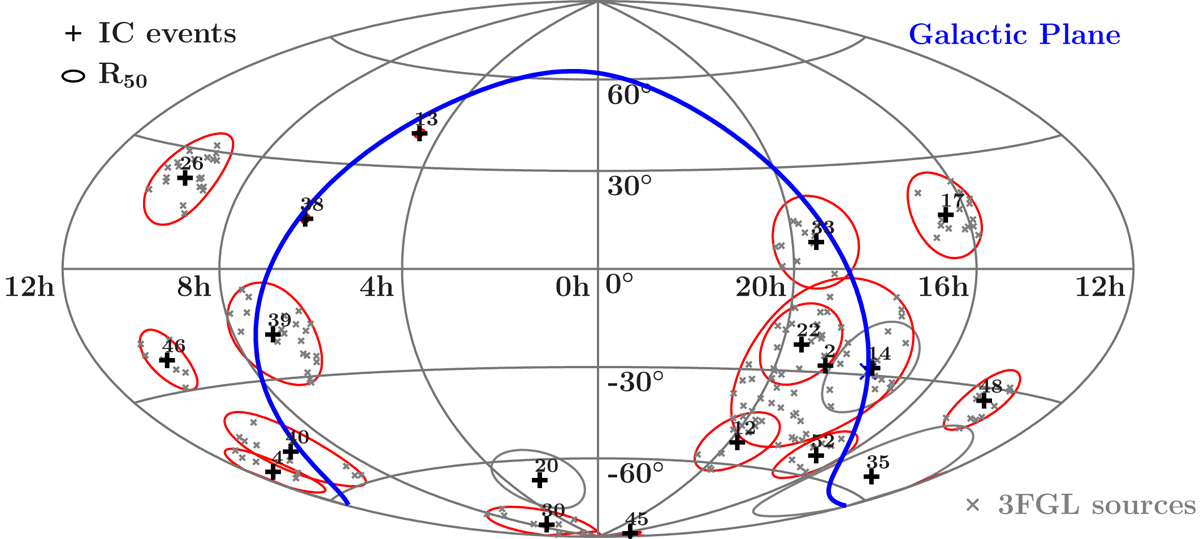
Hammer-Aitoff projection of the sky in right ascension and declination including all HESE events above 100 TeV (red), and above 1 PeV (gray) in four years of data, with their respective R50 error circles. The 3FGL position of the 3LAC sources consistent with the error circles are shown in gray crosses and the number of the IceCube event is marked above the plus sign, which marks the best-fit position of the origin of the neutrino event.
Current usage metrics show cumulative count of Article Views (full-text article views including HTML views, PDF and ePub downloads, according to the available data) and Abstracts Views on Vision4Press platform.
Data correspond to usage on the plateform after 2015. The current usage metrics is available 48-96 hours after online publication and is updated daily on week days.
Initial download of the metrics may take a while.