Fig. 2.
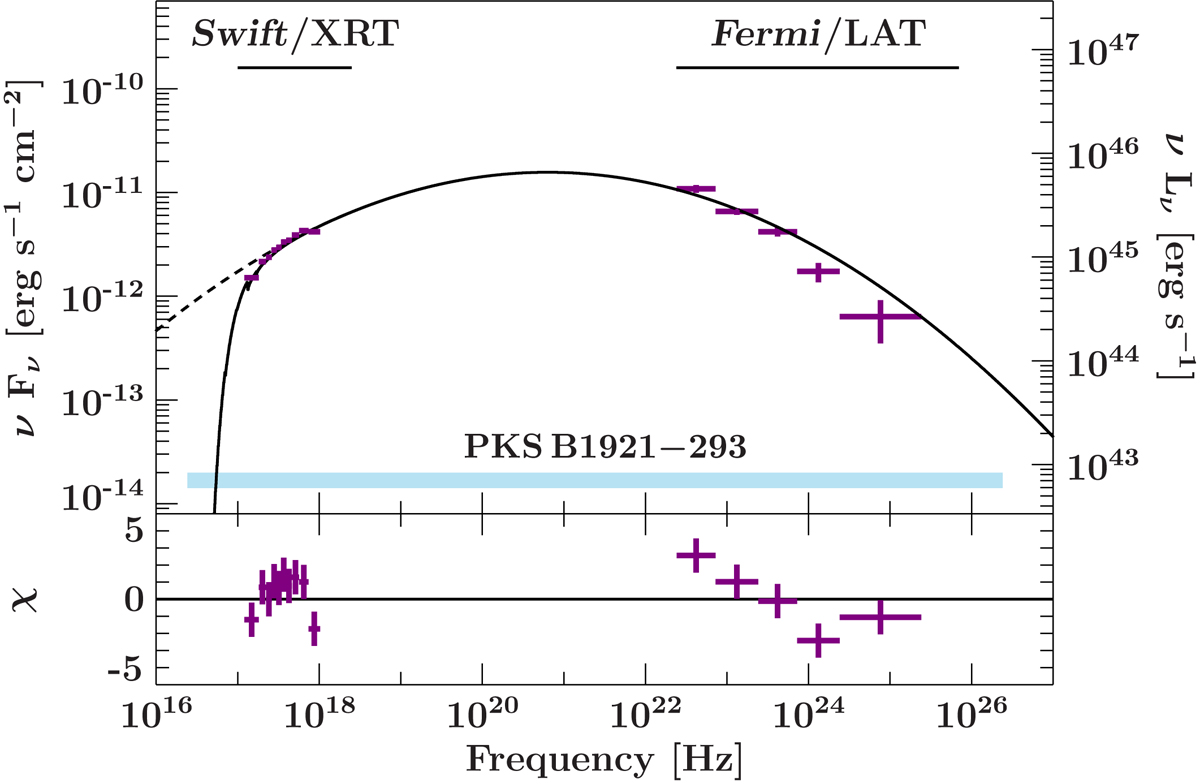
Example SED with good Swift/XRT data that is well described by a logarithmic parabola (solid line). The unabsorbed model is shown as a dashed line. Residuals are shown in the lower panel. The energy range that is used for integrating the electromagnetic flux is given by the blue bar. The SEDs of the other sources are given in Fig. B.1–B.13.
Current usage metrics show cumulative count of Article Views (full-text article views including HTML views, PDF and ePub downloads, according to the available data) and Abstracts Views on Vision4Press platform.
Data correspond to usage on the plateform after 2015. The current usage metrics is available 48-96 hours after online publication and is updated daily on week days.
Initial download of the metrics may take a while.