Fig. 6.
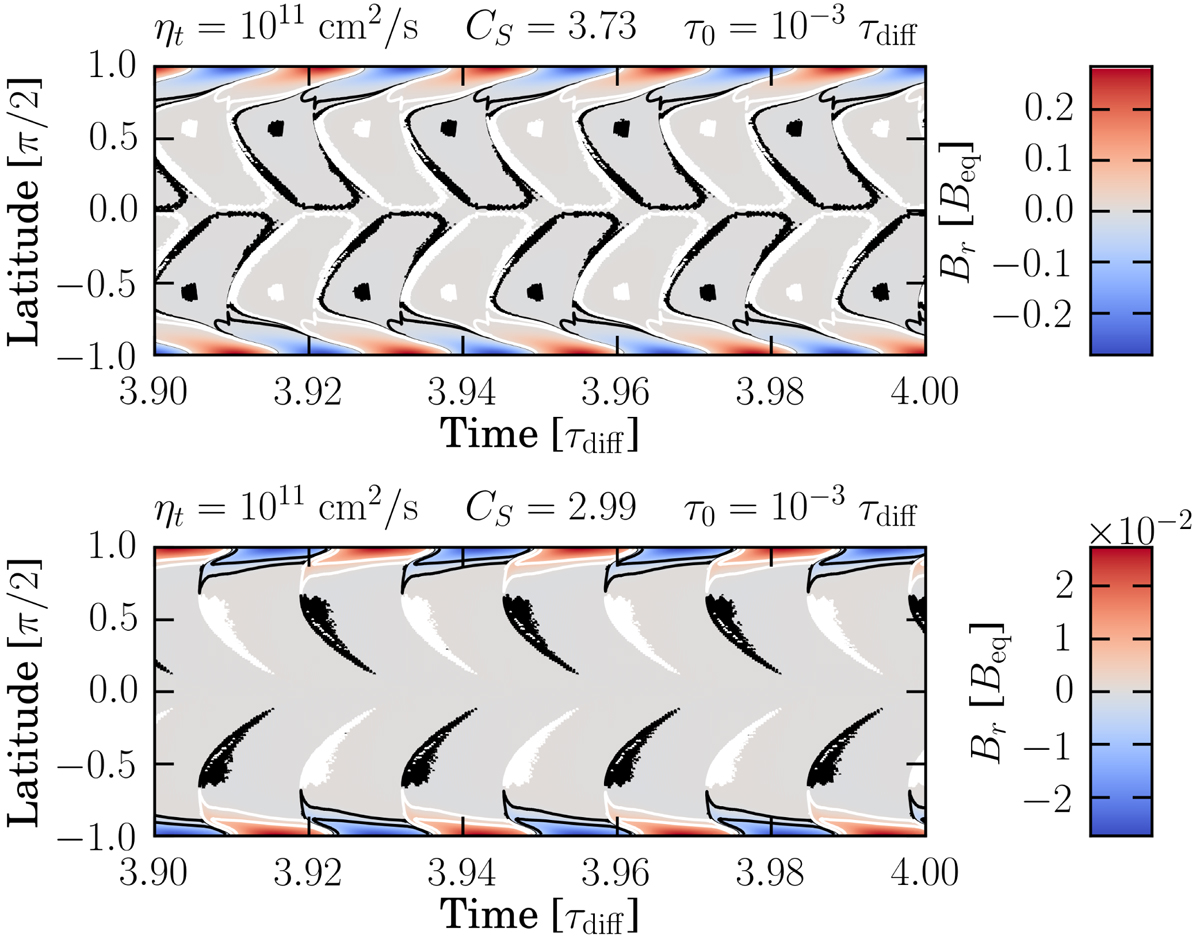
Radial magnetic field at the surface as a function of time from the advection-dominated case with delay (D-ADV) for two source term amplitudes CS. The respective parameters are indicated above the plot. The black solid lines represent the 1.5 and 0.15% levels of ![]() for the short-τeff case (top panel), and the 25 and 2.5% levels for the long-τeff case (bottom panel).
for the short-τeff case (top panel), and the 25 and 2.5% levels for the long-τeff case (bottom panel).
Current usage metrics show cumulative count of Article Views (full-text article views including HTML views, PDF and ePub downloads, according to the available data) and Abstracts Views on Vision4Press platform.
Data correspond to usage on the plateform after 2015. The current usage metrics is available 48-96 hours after online publication and is updated daily on week days.
Initial download of the metrics may take a while.