Fig. 2.
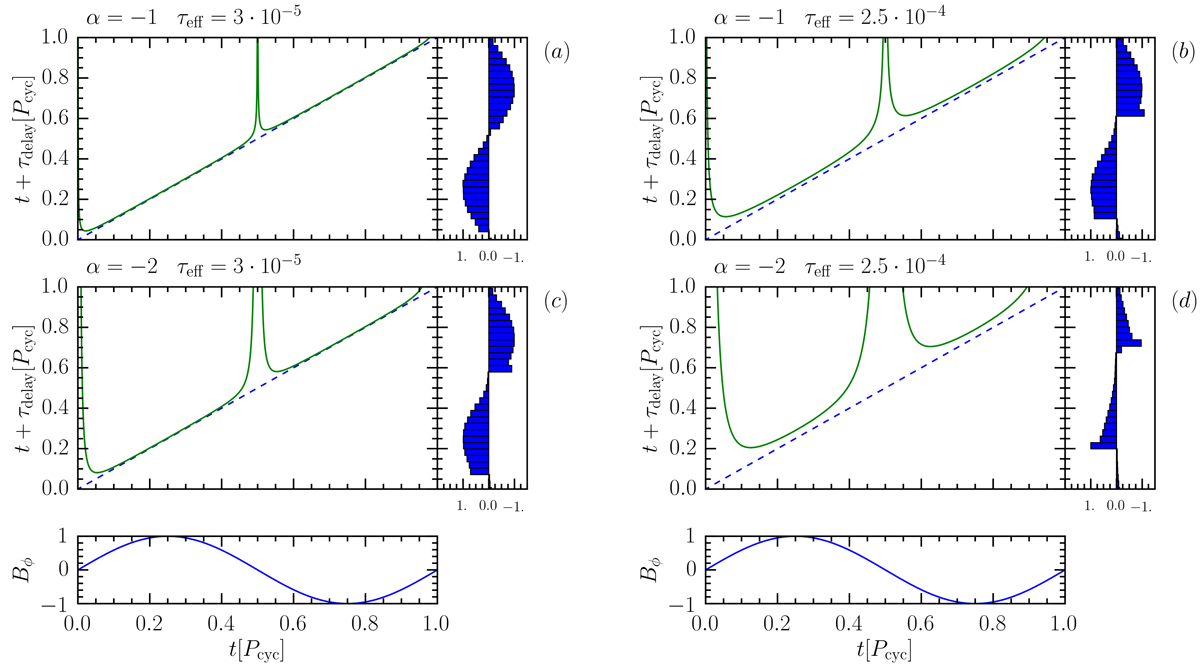
Zero-dimensional toy model illustrating the effect of the delay. In each panel the green curve represents the evolution of the delay with time for a given Bϕ, indicated in the lower panels as the blue curve. The dashed line represents time. The histogram on the right-hand side represents the resulting source term S normalized in arbitrary units. Panels a and b illustrate the case of a weakly nonlinear delay (α = −1), and panels c and d show a nonlinear delay (α = −2). Panels a and c show a short effective delay (e.g., ![]() and τ0 = 3 · 10−5 Pcyc) and panels b and d show a long effective delay (e.g.,
and τ0 = 3 · 10−5 Pcyc) and panels b and d show a long effective delay (e.g., ![]() and τ0 = 10−3 Pcyc).
and τ0 = 10−3 Pcyc).
Current usage metrics show cumulative count of Article Views (full-text article views including HTML views, PDF and ePub downloads, according to the available data) and Abstracts Views on Vision4Press platform.
Data correspond to usage on the plateform after 2015. The current usage metrics is available 48-96 hours after online publication and is updated daily on week days.
Initial download of the metrics may take a while.