Fig. 10.
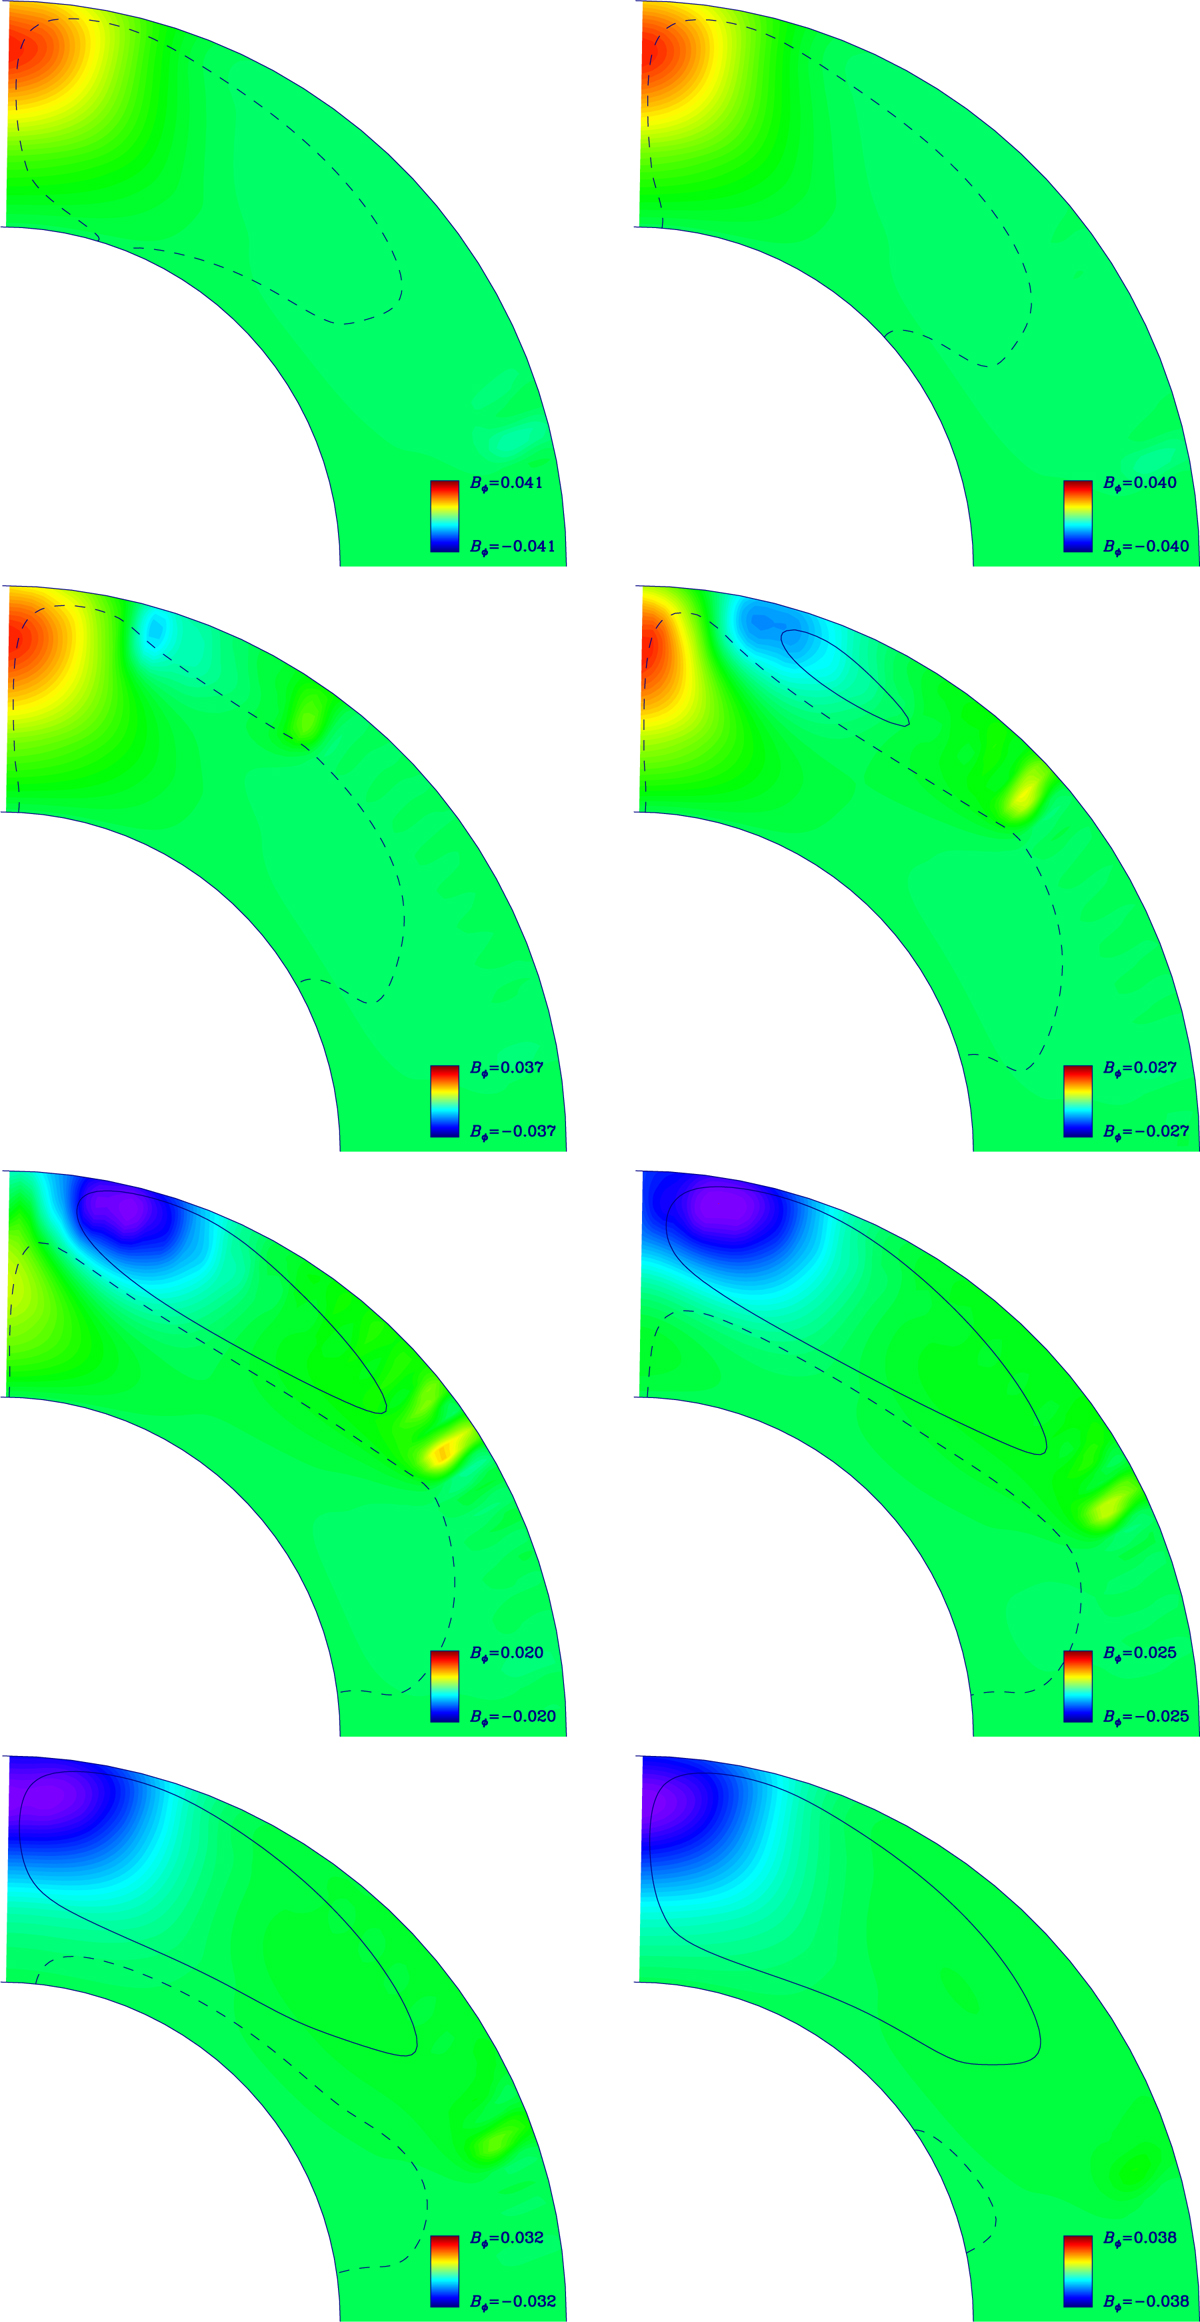
Slices of the northern hemisphere. The slices are taken at different phases of the cycle, ordered from left to right and top to bottom panels: the rising phase, the maximum phase, the declining phase, and the minimum of the activity cycle. The colored contours represent the radial magnetic field, with red pointing outward and blue inward. Contours are 5% and 2.5% of the maximum Bϕ.
Current usage metrics show cumulative count of Article Views (full-text article views including HTML views, PDF and ePub downloads, according to the available data) and Abstracts Views on Vision4Press platform.
Data correspond to usage on the plateform after 2015. The current usage metrics is available 48-96 hours after online publication and is updated daily on week days.
Initial download of the metrics may take a while.