Free Access
Fig. 1.
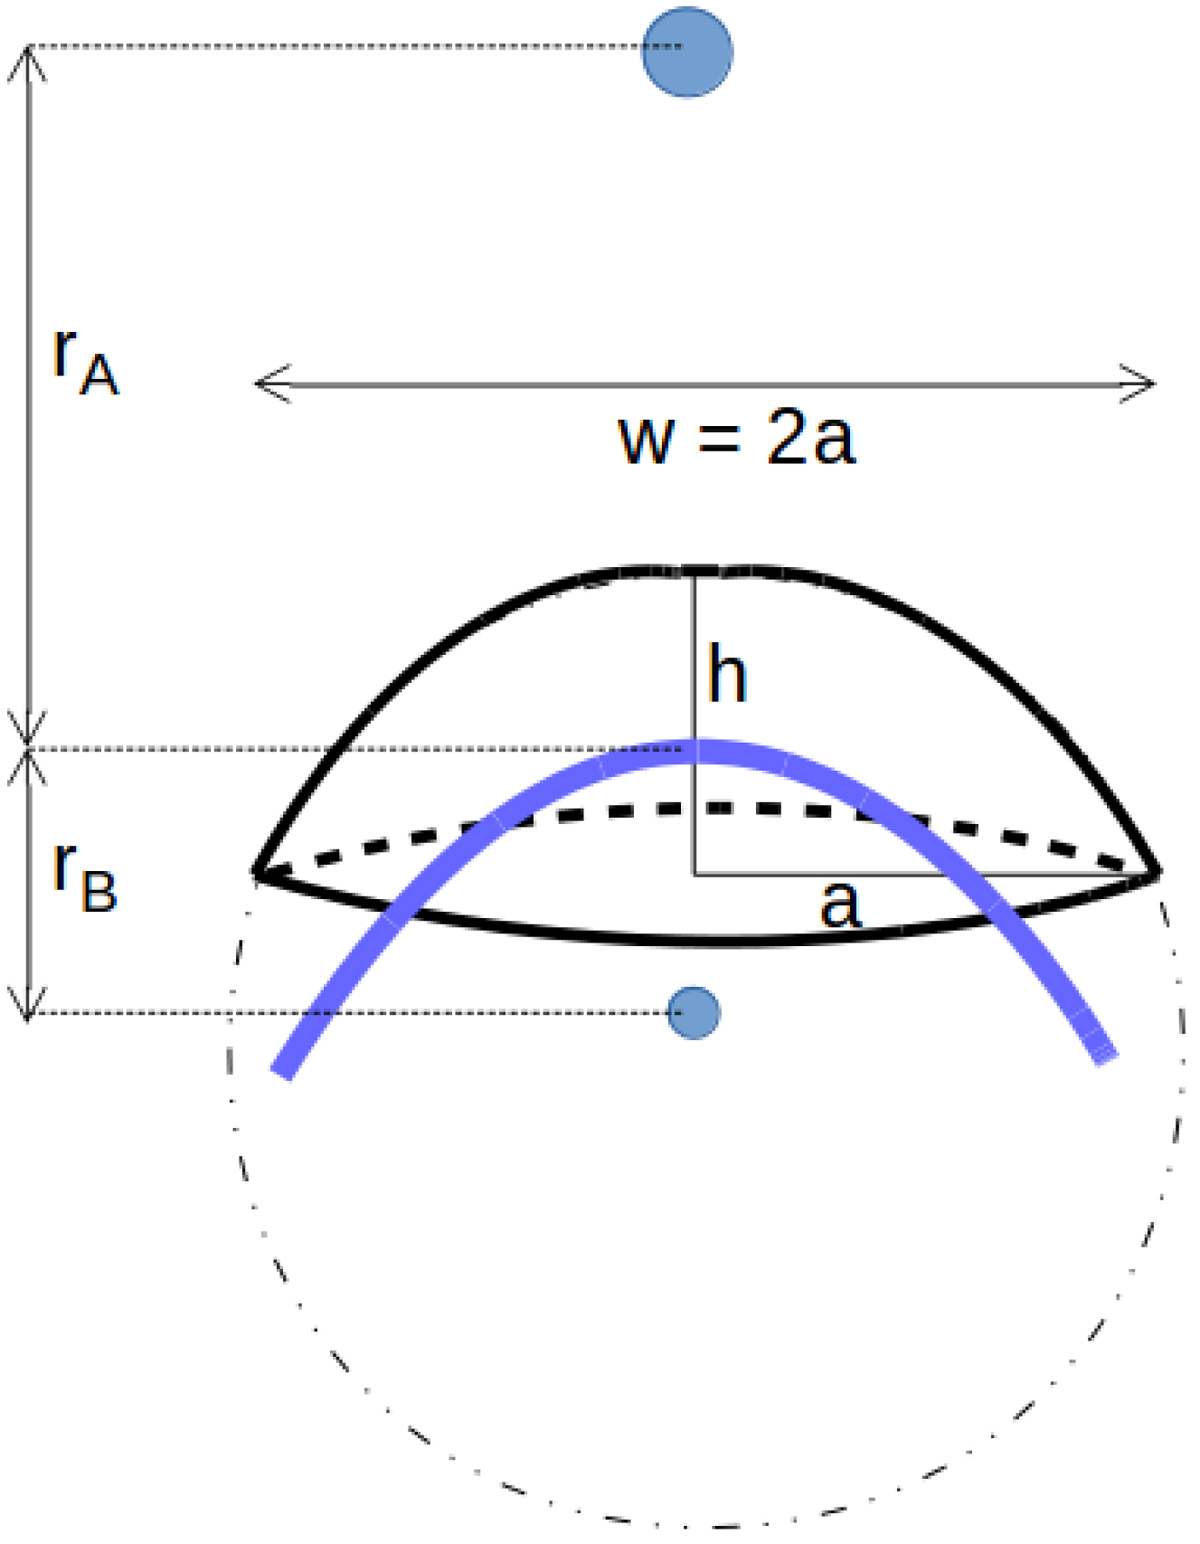
Illustration of the synchrotron-emitting region as a spherical cap (thick solid black lines). The thick blue curve represents the contact discontinuity of the wind-wind interaction region wrapped around the star with the weakest wind (lower blue filled circle).
Current usage metrics show cumulative count of Article Views (full-text article views including HTML views, PDF and ePub downloads, according to the available data) and Abstracts Views on Vision4Press platform.
Data correspond to usage on the plateform after 2015. The current usage metrics is available 48-96 hours after online publication and is updated daily on week days.
Initial download of the metrics may take a while.