Free Access
Fig. B.1.
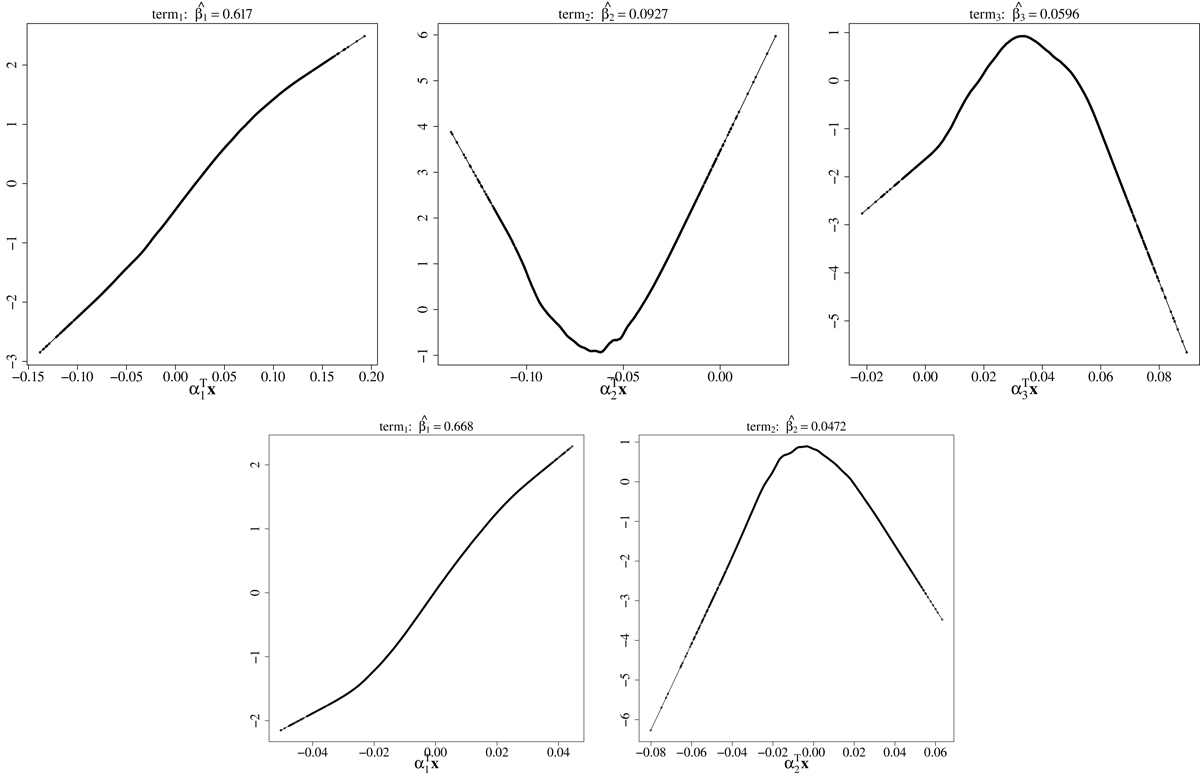
Top row: three identified ridge functions for PPR models specified in Eq. (8) for the MS phase. The β coefficients from the fit are also shown. Bottom row: same as in the top row but for the two ridge function in the RGB phase.
Current usage metrics show cumulative count of Article Views (full-text article views including HTML views, PDF and ePub downloads, according to the available data) and Abstracts Views on Vision4Press platform.
Data correspond to usage on the plateform after 2015. The current usage metrics is available 48-96 hours after online publication and is updated daily on week days.
Initial download of the metrics may take a while.