Fig. 4
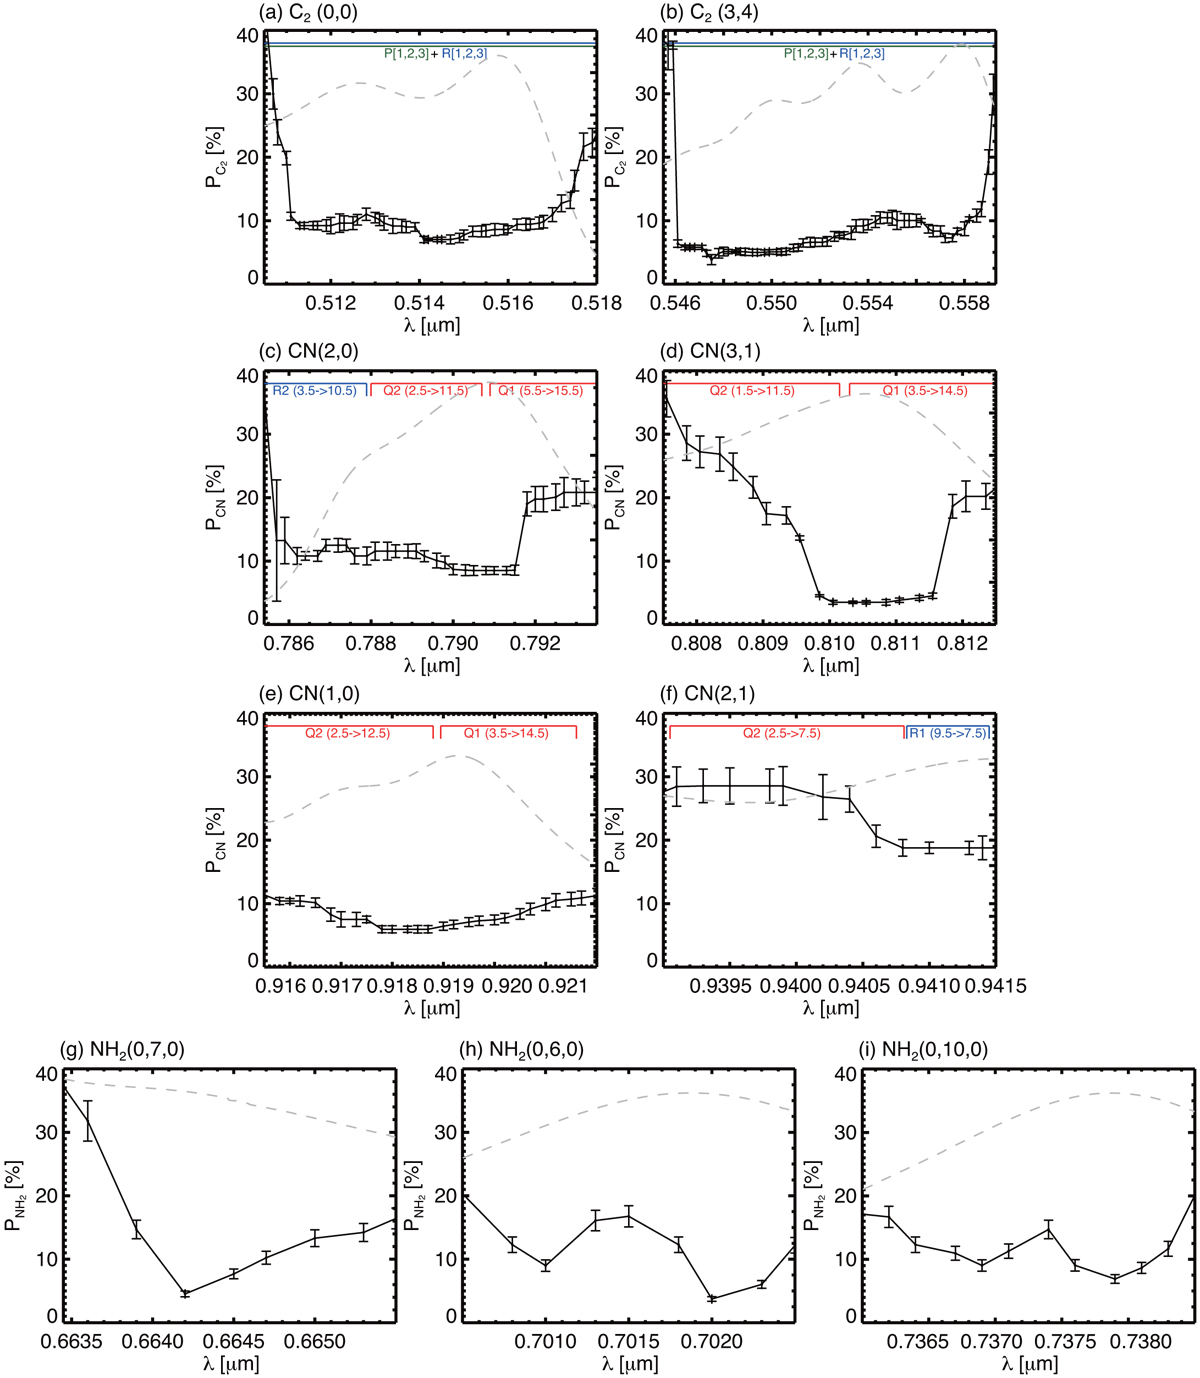
Panels a and b: Pgas of C2 (0,0) and C2 (3,4), respectively. Panels c–f: Pgas of the CN(2,0), CN(3,1), CN(1,0), and CN(2,1) transitions, panels g–i: those of the NH2 (0,7,0), (0,6,0), and (0,10,0) α bands, respectively. Solid lines are median-smoothed within the wavelength resolution (i.e., Δ λ ~ 0.002 μm), and the background gray dashed lines present the modeled distributions of line emissions under the fluorescence equilibrium at the observation geometry of 2P. The right axis of panels a–i was arbitrarily scaled for visibility. More detailed information is described in the text.
Current usage metrics show cumulative count of Article Views (full-text article views including HTML views, PDF and ePub downloads, according to the available data) and Abstracts Views on Vision4Press platform.
Data correspond to usage on the plateform after 2015. The current usage metrics is available 48-96 hours after online publication and is updated daily on week days.
Initial download of the metrics may take a while.