Fig. 3
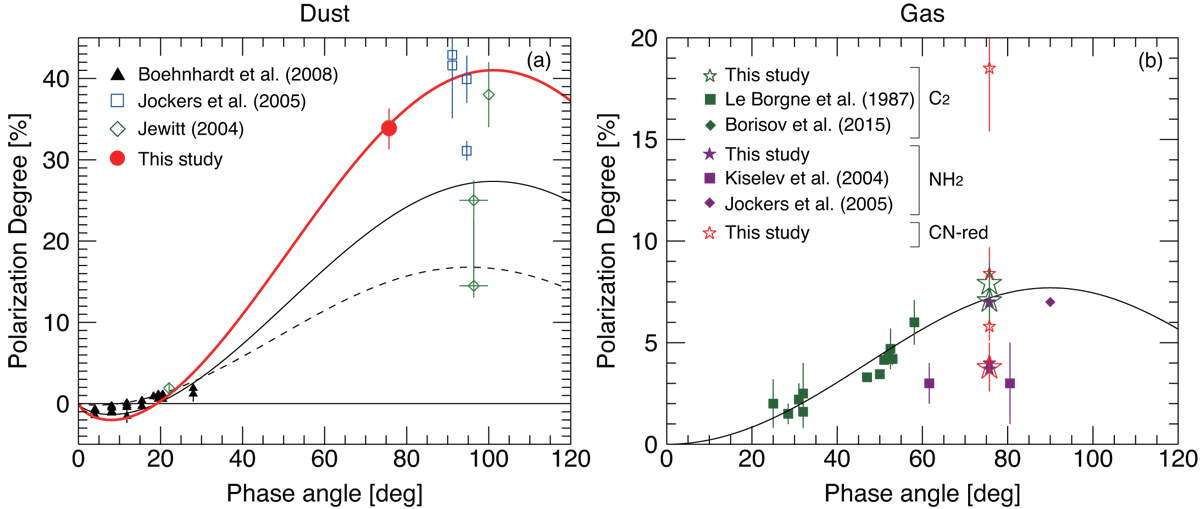
Phase angle dependence of Pcont, r (panel a) and Pgas, r (panel b). In panel a, the thick solid line shows the trend of the 2P continuum component weighted by the data errors. The solid and dashed lines denote the average trends of high- and low-Pmax comets, respectively. The filled symbols denote the data used in fitting, and open symbols are the excluded ones. The solid curve in panel b denotes the empirical phase function of fluorescence lines (Öhman 1941). The molecules analyzed in this study are expressed as stars. The meanings of the different symbols are given in the legend at the top left panel. Open stars of C2 bands and of CN(3,1) are enlarged to avoid mutual overlapping.
Current usage metrics show cumulative count of Article Views (full-text article views including HTML views, PDF and ePub downloads, according to the available data) and Abstracts Views on Vision4Press platform.
Data correspond to usage on the plateform after 2015. The current usage metrics is available 48-96 hours after online publication and is updated daily on week days.
Initial download of the metrics may take a while.