Fig. 2
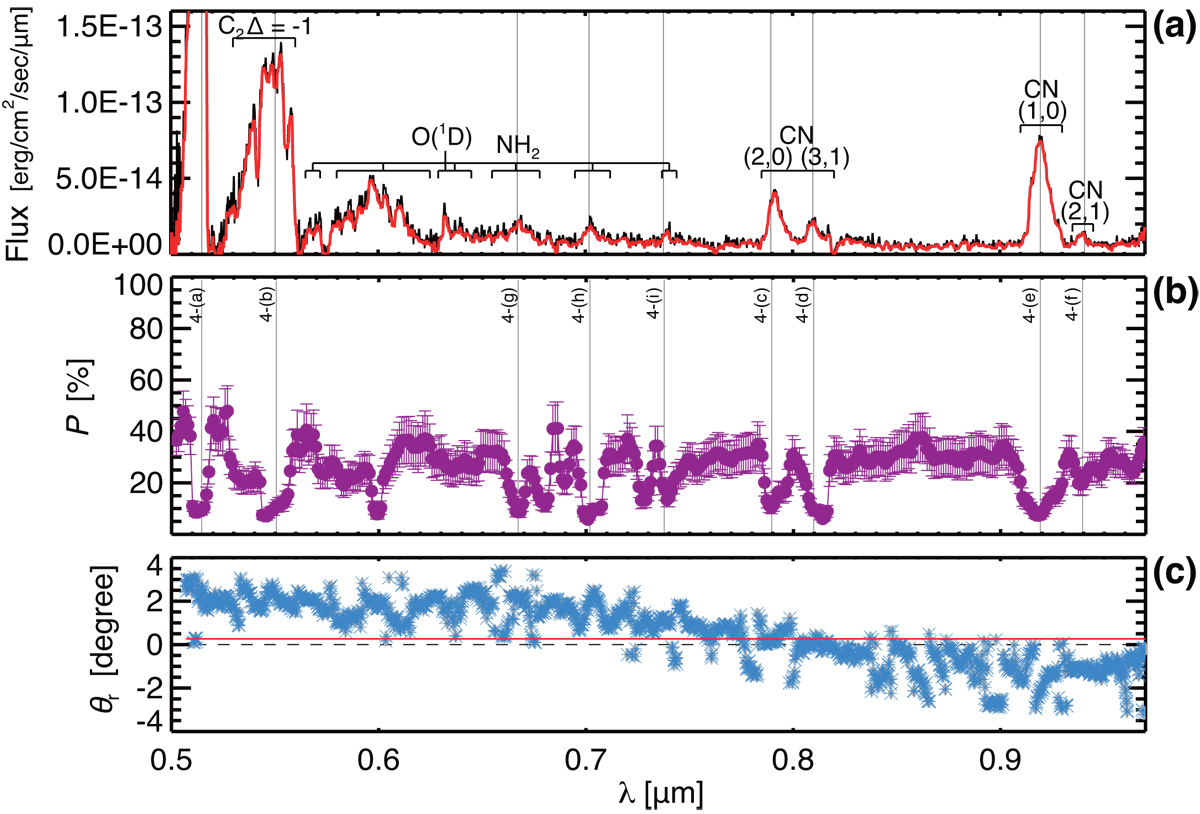
Flux (panel a), P (panel b), and θr (panel c) of 2P observed on UT 2017 February 21 by HHO/HONIR as a function of wavelength. In panel a, we name the branches of discernible line emissions. The red line is a median-smoothed line of the original black points within the size of wavelength resolution. In panel b, the binned-average P is calculated within a rectangle region of 2.′′2 × 5.′′8. We mark the analyzed emission lines with the vertical lines in panels a and b. In panel c, the horizontal red line denotes the average θr of 0°.4.
Current usage metrics show cumulative count of Article Views (full-text article views including HTML views, PDF and ePub downloads, according to the available data) and Abstracts Views on Vision4Press platform.
Data correspond to usage on the plateform after 2015. The current usage metrics is available 48-96 hours after online publication and is updated daily on week days.
Initial download of the metrics may take a while.