Fig. 1
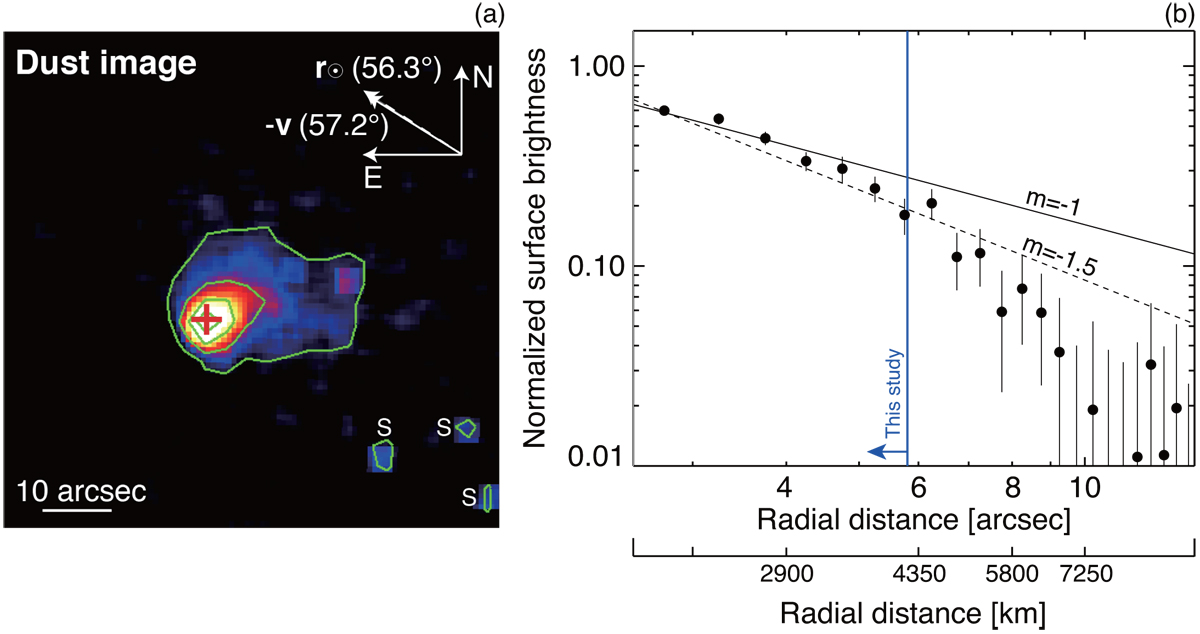
Dust intensity map (panel a) and its radial profile (panel b) after we subtracted the gas components from the observed signals on UT 2017 February 19 by IAO/MITSuME. (a) The photocenter of 2P is markedas a red cross. The contours on 2P are spaced linearly down to one-fifth of the central brightness level (i.e., 95, 70, 45, and 20% flux with regard to the peak flux). The negative velocity (− v) and antisolar (r⊙) vectors projected on the celestial plane are shown as solid and dashed arrows, respectively. North is up and east is left. “S” letters in the bottom right corner denote the remnants of background stars. Panel b: The surface brightness profile of the near-nuclear coma with respect to the radial distance. We binned the radial distance logarithmically over 1.′′ 0–13.′′0, and averaged the data points at intervals of 0.′′5 radial distance each. All brightness points are normalized at the innermost point (0.′′ 2 from the photocenter). The upper solid and lower dashed lines exhibit gradients of −1 and − 1.5, which are typical of cometary dust expanding with initial ejection speed under the solar radiation field (Jewitt & Meach 1987). The blue vertical line at 5.′′ 8 denotes the apertureradius we used.
Current usage metrics show cumulative count of Article Views (full-text article views including HTML views, PDF and ePub downloads, according to the available data) and Abstracts Views on Vision4Press platform.
Data correspond to usage on the plateform after 2015. The current usage metrics is available 48-96 hours after online publication and is updated daily on week days.
Initial download of the metrics may take a while.