Fig. 3.
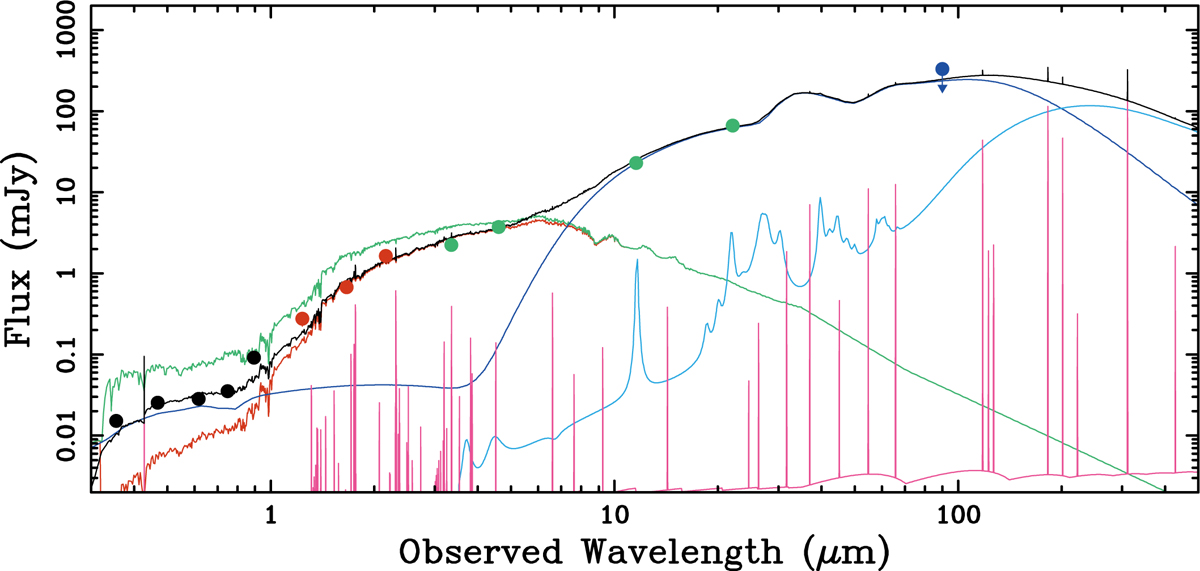
SED fitting of WISE J1042+1641. Filled circles represent the observational data from the SDSS (black), 2MASS (red), and WISE (green). The 5σ upper limit from AKARI is denoted as a blue arrow. The best-fit SED is denoted with the black solid line. Different components are also shown: unattenuated stellar emission (green line), attenuated stellar emission (red line), nebular emission (pink line), SF-heated dust emission (light blue line), and AGN emission (blue line).
Current usage metrics show cumulative count of Article Views (full-text article views including HTML views, PDF and ePub downloads, according to the available data) and Abstracts Views on Vision4Press platform.
Data correspond to usage on the plateform after 2015. The current usage metrics is available 48-96 hours after online publication and is updated daily on week days.
Initial download of the metrics may take a while.