Fig. 4.
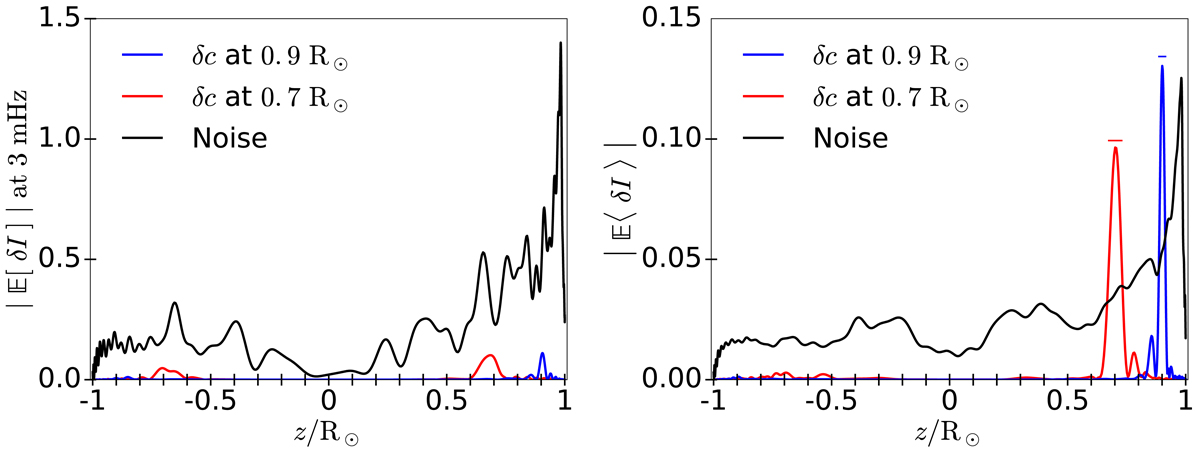
Left panel: image intensity |𝔼[δIαβ(x)]| at a single frequency of 3 mHz, as a function of position x along the z-axis. The sound-speed perturbation (see Eq. (54)) is placed at two different positions along the z-axis, zs = 0.7 R⊙ (red) and 0.9 R⊙ (blue). The standard deviation of the noise ![]() is given by the black curve. We note that the jagged aspect of the curves is not due to numerical inaccuracies. Right panel: Image intensity and noise level after averaging over 101 frequencies uniformly distributed in the interval from 2.75 to 3.25 mHz. The frequency resolution is 5 μHz, implying an observation duration of T = 55.5 h. A horizontal line segment is plotted at each depth to mark half of the local wavelength.
is given by the black curve. We note that the jagged aspect of the curves is not due to numerical inaccuracies. Right panel: Image intensity and noise level after averaging over 101 frequencies uniformly distributed in the interval from 2.75 to 3.25 mHz. The frequency resolution is 5 μHz, implying an observation duration of T = 55.5 h. A horizontal line segment is plotted at each depth to mark half of the local wavelength.
Current usage metrics show cumulative count of Article Views (full-text article views including HTML views, PDF and ePub downloads, according to the available data) and Abstracts Views on Vision4Press platform.
Data correspond to usage on the plateform after 2015. The current usage metrics is available 48-96 hours after online publication and is updated daily on week days.
Initial download of the metrics may take a while.