Free Access
Fig. 9.
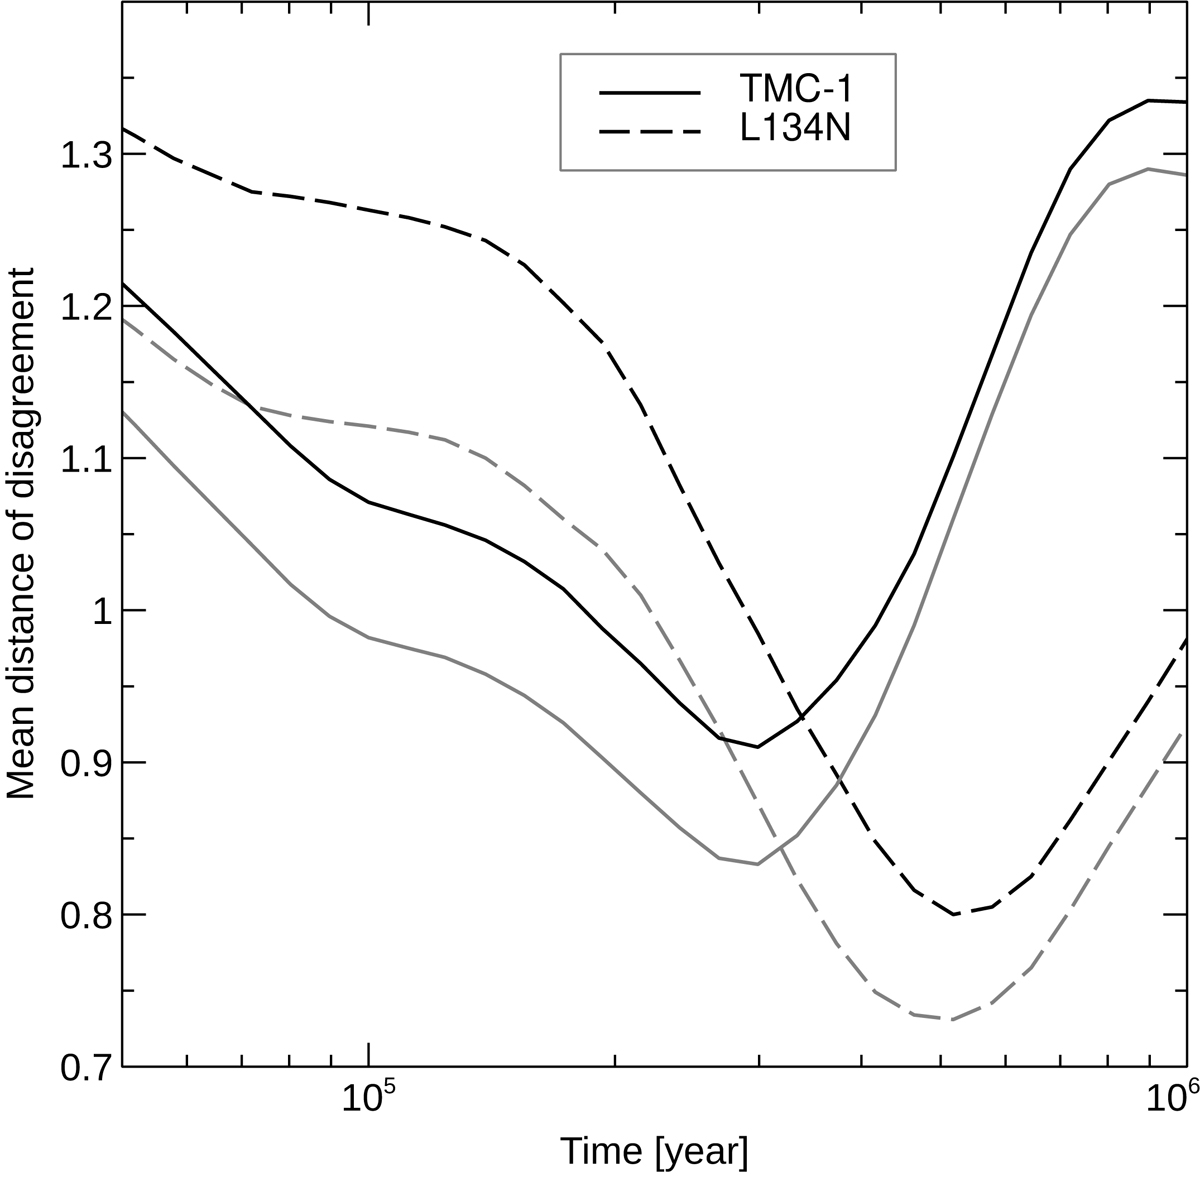
Mean distance of disagreement as a function of time for different models. The black lines show the model in which μs = 0.4 for all species, and the gray lines show the model with best-fit values of μs for H2, CH3 , and CO.
Current usage metrics show cumulative count of Article Views (full-text article views including HTML views, PDF and ePub downloads, according to the available data) and Abstracts Views on Vision4Press platform.
Data correspond to usage on the plateform after 2015. The current usage metrics is available 48-96 hours after online publication and is updated daily on week days.
Initial download of the metrics may take a while.