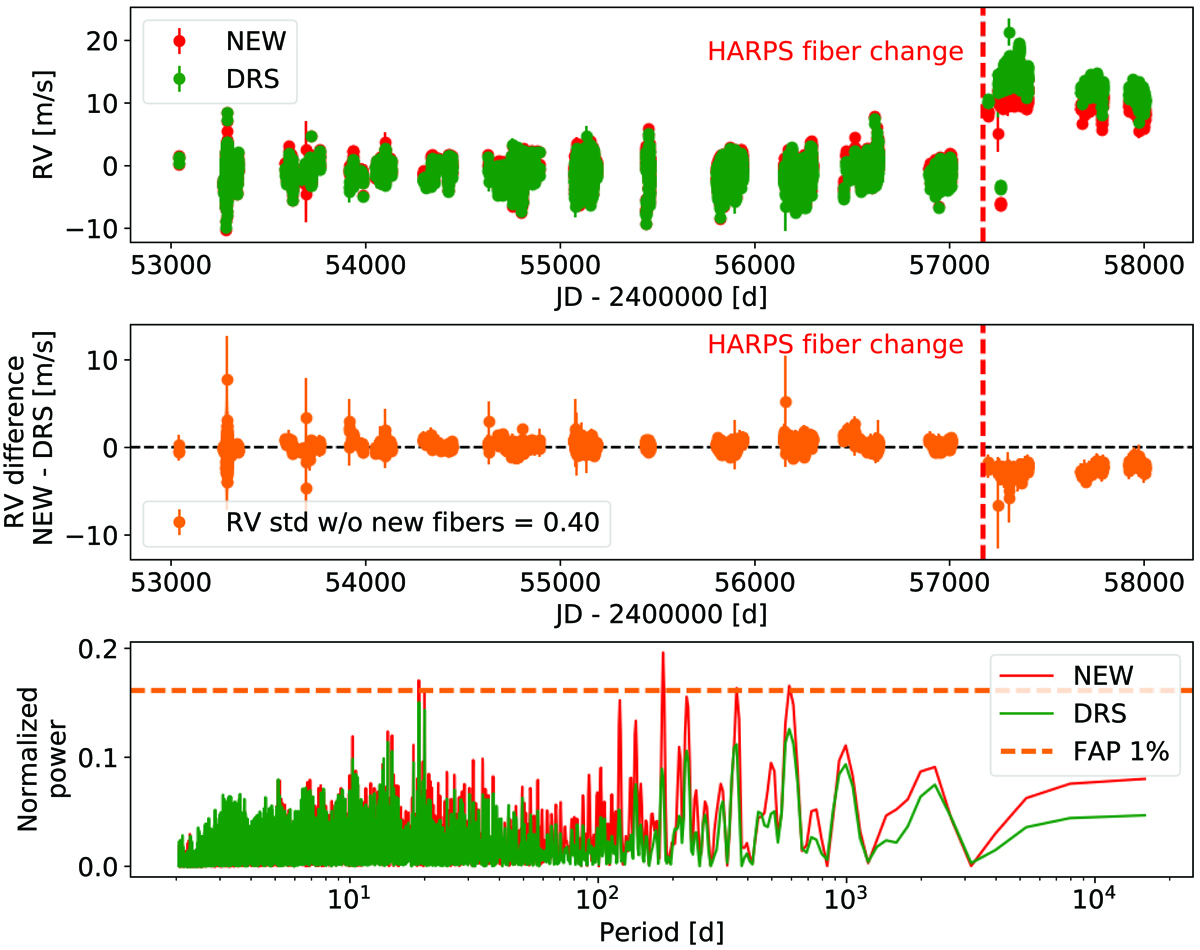
Fig. 1.

Top panel: comparison of the RVs of τ Ceti derived using our new RV extraction procedure (red) with the RVs estimated from the HARPS DRS (green). The red vertical dashed line corresponds to the change from circular to octagonal fibres that was performed on HARPS on the 1st of June 2015 (JD = 2457174). Middle panel: difference between the RVs derived using our new RV extraction procedure and the RVs from the HARPS DRS. We show in the legend the standard deviation of the RV difference for the measurements preceding the fibre change. Bottom panel: periodograms of the RVs derived using our new RV extraction procedure (red) and the RVs derived by the HARPS DRS (green). To calculate those periodograms, we rejected the data after the fibre change to prevent low frequency signals induced by the observed offset. The two periodograms have been normalised in such a way that their FAP of 1% coincide.
Current usage metrics show cumulative count of Article Views (full-text article views including HTML views, PDF and ePub downloads, according to the available data) and Abstracts Views on Vision4Press platform.
Data correspond to usage on the plateform after 2015. The current usage metrics is available 48-96 hours after online publication and is updated daily on week days.
Initial download of the metrics may take a while.


