| Issue |
A&A
Volume 620, December 2018
|
|
|---|---|---|
| Article Number | L14 | |
| Number of page(s) | 5 | |
| Section | Letters to the Editor | |
| DOI | https://doi.org/10.1051/0004-6361/201833760 | |
| Published online | 17 December 2018 | |
Letter to the Editor
Discovery of an X-ray nebula in the field of millisecond pulsar PSR J1911–1114
1
Department of Space Science and Geology, Chungnam National University, Daejeon 34134, Korea
e-mail: This email address is being protected from spambots. You need JavaScript enabled to view it.
2
Department of Astronomy and Space Science, Chungnam National University, Daejeon 34134, Korea
e-mail: This email address is being protected from spambots. You need JavaScript enabled to view it.
, This email address is being protected from spambots. You need JavaScript enabled to view it.
3
Institute of Particle Physics and Astronomy, Huazhong University of Science and Technology, PR China
4
Department of Physics, UNIST, Ulsan, 44919, Korea
Received:
3
July
2018
Accepted:
5
November
2018
Abstract
We have discovered an extended X-ray feature, apparently associated with millisecond pulsar (MSP) PSR J1911–1114. The feature, which extends for ∼1′, was discovered from an XMM-Newton observation; the radio timing position of PSR J1911–1114 is in the midpoint of the feature. The orientation of the feature is similar to the proper motion direction of PSR J1911–1114. Its X-ray spectrum can be well-modeled by an absorbed power law with a photon index of Γ = 1.8−+0.30.2. If this feature is confirmed to be a pulsar wind nebula (PWN), this will be the third case where an X-ray PWN has been found to be powered by a MSP.
Key words: pulsars: individual: PSR J1911–1114 / X-rays: stars / stars: neutron
© ESO 2018
1. Introduction
Millisecond pulsars (MSPs) are old neutron stars with a rotation period of ≲20 ms. The population of MSPs has expanded considerably in the last decade (please refer to Hui 2014 and references therein for a review). In view of the enlarged samples, we have carried out a systematic survey of their X-ray properties with all the archival X-ray data accessible through HEASARC Archive1 providing imaging and spectral information (Lee et al. 2018). Forty-seven MSPs are firmly detected in X-ray (Table 1 in Lee et al. 2018) and X-ray flux upper limits from 36 other MSPs are placed with the existing data (Table 2 in Lee et al. 2018). In re-examining the X-ray conversion efficiency with these censored data, we found a relation of  erg s−1 (2−10 keV). We have also identified some possible different X-ray properties among different black-widow and redback MSPs (we refer to Figs. 2 and 3 in Lee et al. 2018).
The archival X-ray imaging data also allow us to search for the existence of diffuse X-ray emission around MSPs. We inspected the archival X-ray images of all 47 X-ray detected MSPs. In one XMM-Newton observation, we identified an interesting extended feature in the field of PSR J1911–1114 (hereafter J1911).
Currently, there are ≳70 pulsar wind nebulae (PWNe) detected in the X-ray (see Kargaltsev et al. 2013). However, only two of them are associated with MSPs, namely the isolated MSP PSR J2124–3358 (Hui & Becker 2006a; Romani et al. 2017; Hui 2018) and the black-widow PSR B1957+20 (Stappers et al. 2003; Huang et al. 2012) showing that X-ray PWNe associated with MSPs are rare.
J1911 was discovered in a radio survey with Parkes (Lorimer et al. 1996). It belongs to a binary with an orbital period of Pb ∼ 2.7 days with a ∼0.1 M⊙ helium white dwarf companion. Its spin period and proper-motion corrected period derivative are 3.6 ms and 1.14 × 10⁻²⁰ s s−1, respectively, which imply its spin-down power, surface B−field and characteristic age to be  erg s−1, Bsurf = 2.28 × 10⁸ G and τ = 4.12 Gyr, respectively. At a distance inferred from its dispersion measure (d = 1.07 kpc), its proper motion implies a traverse velocity of vpsr ∼ 84 km s−1. Its position has been found at RA = 19h11m49.283s, Dec = −11°14′22.481″ (J2000) by radio pulsar timing (Desvigness et al. 2016).
Here we report the detection of the extended X-ray feature that possibly associated with J1911 and present the results from a detailed analysis.
2. Observation and data reduction
J1911 was observed by XMM-Newton on 2007-04-27 with a total exposure time of ∼68 ks (ObsID: 0406620201). MOS1/2 cameras were operated in full frame mode with a medium filter. On the other hand, the PN camera was operated in timing mode with a thin filter. As the data obtained by the PN camera do not provide the two-dimensional (2D) spatial information and the one-dimensional (1D) image is too poor to resolve the contribution from J1911, we do not consider the PN data in this analysis.
We used XMM-Newton Standard Analysis System (XMMSAS version 17.0.0) software for data reduction and analysis. By running the XMMSAS task emchain, we generated the calibrated photon event files for MOS1/2 data with the most updated calibration data files. We restricted all the subsequent analyses in an energy range of 0.3−10 keV. We further cleaned the data by removing the time segments with the high background. In examining the light curves constructed from the full data in each camera, we kept the good time intervals (GTIs) with the count rates < 4.5 cts s−1 and < 5 cts s−1 in MOS1 and MOS2, respectively. After the GTI filtering, effective exposures of ∼43 ks are retained in each camera.
3. Spatial analysis
Figure 1 shows a 2′ × 2′ merged MOS1/2 image with a bin-size of 1.25″ × 1.25″ and smoothed with a Gaussian kernel of 3″. A bright extended feature with an orientation similar to the proper motion of J1911 can be clearly seen in this field. The whole feature is detected at a signal-to-noise ratio (S/N) of ∼10σ in the combined MOS 1/2 data, which was calculated within 40″ at the center of radio position (see Eq. (1) in Hui et al. 2017). We have also searched for the objects in the field of the feature with SIMBAD. Besides J1911, two optical sources are found in the direction of this feature from the United States Naval Observatory (USNO-B1.0) catalog (Monet et al. 2003). Their locations are illustrated by the black circles A and B in Fig. 1. These sources are also found in the 2MASS catalog (Skrutskie 2006). The B band magnitudes of sources A and B as given by the USNO-B1.0 catalog are 15.38 and 16.78, respectively. To shed light on the nature of these optical sources, we compute their X-ray to optical flux ratio (FX/Fopt). We estimated their unabsorbed X-ray fluxes in 0.1−2.4 keV from an aperture with a radius of 4″ centered at their position. At 0.1−2.4 keV, log(FX/Fopt) of A and B are found to be ∼ − 3.8 and ∼ − 3.7, respectively. These values are consistent with that of an F-type star (Krautter et al. 1999). As there is no known association between an F star and an extended structure in X-ray, we conclude that these two objects are unlikely to have any association with the X-ray feature.
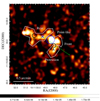 |
Fig. 1. Exposure-corrected image of 2′ × 2′ area around PSR J1911–1114 as observed by MOS1/2 in 0.3−10 keV. The blue cross illustrates the radio timing position of J1911. The blue circle shows the point-like X-ray source and all the other white dashed regions illustrate various components of the extended feature. The green arrow represents the proper motion direction of J1911. The scale bar at the bottom is the pixel values in units of photons cm−2 s−1. Black circles indicate the identified optical sources. |
To investigate the structure of the extended feature, we computed its brightness profile by sampling from 18 consecutive bins with a size of 5″ × 40″ that entirely cover the whole feature (see the top panel in Fig. 2). To estimate the background level, we randomly sampled ten 35″ × 25″ source-free regions around the feature. The background sampling regions are also shown in the top panel in Fig. 2. The brightness profile as obtained from the MOS1/2 data is shown in the lower panel of Fig. 2. The extent of the feature is estimated as the length of both ends of the profile falling into the background. Its length is found to be ∼60″ ± 5″. The uncertainty of the length is estimated by the half width of the adopted bin size at both ends of the feature.
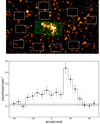 |
Fig. 2. Top panel: sampling regions of brightness profile (green) and background (white). Bottom panel: brightness profile of the elongated feature. The solid line and dashed horizontal lines are averaged background level and 1σ uncertainties, respectively. Zero in the x-axis is chosen at the radio timing position. The profile expected for a point spread function is illustrated by the dotted line. |
The peak located at ∼25″ from the front end has a S/N ratio of ∼7.0σ. As it resembles a point-like source, we have further examine its spatial extent. To account for the instrumental effect, we simulated the point spread function (PSF) at 1.5 keV and the off-axis angle of this point-like feature (∼16″) with XMMSAS task psfgen. We then computed the brightness profile from the simulated data in the same way as mentioned above. The estimated point-source profile is shown in Fig. 2 as a dotted line. While the profile of the whole feature is significantly different from that of a point source, its peak does approximately follow a point-like structure locally.
To further determine the spatial properties of this point-like feature, we followed Hui & Becker (2006b), using the simulated PSF as a convolution kernal for fitting the unsmoothed image centered at this feature with a 2D Gaussian plus a 2D constant background model. The best-fit model yields a position of RA = 19h11m48.220s, Dec = −11°14′27.70″ (J2000) with a statistical error of ∼1.3″ and a full width at half maximum (FWHM) of  arcsec.
Besides the point-like source, we divide the whole feature into several spatial components for the subsequent analysis (see Fig. 1). We refer to the long tail-like structure trailing J1911’s proper motion as the “rear” component. It has a S/N ratio of 7.9σ in this MOS1/2 data. For the emission at the opposite side, we further dissect it into two components, namely the “front” and “protrusion”. Both components are detected with an S/N of ∼5σ.
4. Spectral analysis
We extracted the MOS1 and MOS2 spectra of the whole feature from all the regions shown in Fig. 1. Background spectra are sampled from the nearby source-free regions in the corresponding cameras. The background-subtracted counts of the feature collected by both MOS1 and MOS2 cameras is ∼270 cts.
With the aim to tightly constrain the spectral parameters, we fit the spectra obtained by MOS1 and MOS2 simultaneously with an absorbed power law (PL) using the XSPEC package (ver.12.9). For the parameter estimation, assuming uniform priors for all parameters, we obtained a multi-dimensional posterior probability distribution for all parameters by Markov Chain Monte Carlo (MCMC). We adopted the sampling algorithm devised by Goodman & Weare (2010). After initial burn-in, we used a set of eight walkers, each going for 50 000 steps (e.g., Danilenko et al. 2015). Using these 400 000 samples to approximate the posterior probability distribution (see Fig. 4), we estimated the best-fit and the 68.2% credible intervals of the model parameters through the Bayesian approach.
The whole feature can be described well by an absorbed PL model with a column density of  cm−2 and a photon index of
  . The inferred NH is comparable to the total Galactic HI column density in the direction of J1911 (Kalberla et al. 2005; Dickey & Lockman 1990). The unabsorbed flux in 0.3−10 keV is found to be
  erg cm−2 s−1. The best-fit PL and the residuals for the observed spectra of the whole feature are shown in Fig. 3.
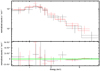 |
Fig. 3. Binned spectrum of the whole feature associated with J1911 as observed by MOS1/2 with the best estimated PL model overplotted (upper panel) and the fitting residuals (lower panel). |
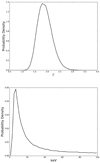 |
Fig. 4. 1D marginalized posterior probability distributions of photon index (upper panel) and the plasma temperature (lower panel) as inferred from the non-thermal and thermal scenarios, respectively. |
We have also considered a purely thermal scenario by fitting the X-ray spectrum of J1911 with an absorbed thermal bremsstrahlung model (see Marelli et al. 2013). The best-fit model yields  cm−2 and a plasma temperature of
  keV. The unabsorbed flux is found to be
  erg cm−2 s−1 (0.3−10 keV). In examining the fitting residuals, we do not identify any systematic deviation. However, in comparing the posterior probability distribution of kT and that of Γ, we found that kT is poorly constrained. These results are summarized in Table 1.
X-ray properties of the whole feature in the field of PSR J1911–1114.
We have also examined if there is any spectral variation among different spatial components as identified in Fig. 1. However, within the tolerance of the statistical errors, we do not find any significant variation across the whole feature.
5. Summary and discussion
We have discovered an extended X-ray feature of ∼60″ ± 5″ in the field of the MSP J1911 at a significance of ∼10σ. At a distance of d ∼ 1 kpc, this corresponds to a physical size of ∼1018 cm. Its X-ray spectrum can be well-described by a PL with Γ ∼ 1.8. On the other hand, a thermal bremsstrahlung with kT ∼ 6.8 keV can result in a comparable goodness-of-fit, though the parameter cannot be properly constrained. In the following, we discuss the implications of both scenarios.
Comparing to the other two MSPs (i.e., PSRs B1957+20 and J2124–3358) which have X-ray nebulae associated, the X-ray morphology of J1911’s nebula has two major differences. First, while the X-ray tails powered by PSRs B1957+20 and J2124–3358 have a physical length of the order of ∼3 × 1017 cm (see Stappers et al. 2003; Hui & Becker 2008), the feature associated with J1911 is ∼1018 cm which is about three times longer. Second, the pulsars are located at the end of the tails in the cases of PSRs B1957+20 and J2124–3358. However, J1911 is located around the middle of the feature. For PSRs B1957+20 and J2124–3358, the morphologies of their X-ray nebulae suggest an origin in a synchrotron nebula resulting from the postshock flow. On the other hand, the aforementioned differences between the case of J1911 and these two MSPs suggest that the former nebula is different in its nature.
Since J1911 is at the midpoint of the feature (see Fig. 2), this prompts us to speculate that the feature may be the result of bipolar outflow along the spin axis of the pulsar. Three-dimensional relativistic magnetohydrodynamic simulations of PWNe have demonstrated the formation of the bipolar outflow (see Fig. 14 in Porth et al. 2013). The size of the simulated outflow is found to be comparable with that of the J1911 nebula. Also, assuming it is indeed a bipolar outflow, it suggests the spin axis of J1911 can be in parallel with its proper motion (see Fig. 1). This is consistent with the spin-velocity alignment that has been found in many other pulsars (Noutsos et al. 2012). The brighter part of the feature in the forward direction could be a result of the ram pressure exerted by the motion of J1911.
Assuming a non-thermal scenario, we further model the feature with the one-zone PWN model (Cheng et al. 2006; Chevalier 2000). The model luminosity is given by:
![Mathematical equation: $$ \begin{aligned}&L(0.3{-}10\,\mathrm{keV})={1\over 2}\left({p-2\over p-1}\right)^{p-1}\left({2\over 2-p}\right) \left({6e^2\over 4\pi ^2 m_{\rm e} c^3}\right)^{(p-2)/4}\\&\quad \times \epsilon _{\rm e}^{p-1}\epsilon _B^{(p-2)/4}\gamma _{ w}^{p-2}R_{\rm s}^{-(p-2)/2}{\dot{E}}^{(p+2)/4} \left[{\nu ^{1-p/2}_{10\,\mathrm{keV}} - \nu ^{1-p/2}_{0.3\,\mathrm{keV}}}\right]. \end{aligned} $$](/articles/aa/full_html/2018/12/aa33760-18/aa33760-18-eq18.gif)
In the fast-cooling regime, the observed photon index of the extended feature implies a spectral index of p ∼ 2.2 for the distribution of the synchrotron-emitting electrons. The shock radius is estimated by  (∼0.02′ at 1 kpc), where the spin down power,
  is in units of 1034 ergs s−1, the number density n of the interstellar medium is in units of 1 cm−3, and the pulsar velocity, vp, 100 is in units of 100 km s−1.
Following Cheng et al. (2006), we assume a fractional energy density of electrons ϵe = 0.5, a fractional energy density of the magnetic field ϵB = 0.003, and a Lorentz factor of the wind particles γw = 106 to be the prior inputs. With these physics inputs for a typical PWN, we attempted to compute the model X-ray luminosity by MCMC. For p and Rs, we fixed their values inferred from the observed properties. The parameters ϵe, ϵB, and γw were taken as free parameters. Their priors are assumed to have a Gaussian distribution with a mean and standard deviation of ϵe = 0.5, ϵB = 0.003, γw = 106 and 0.5, 0.3, 103, respectively. Using 40 000 samples, the credible interval of the model luminosity in 0.3−10 keV was calculated within 68.2% with pymc32. It is found to be (1.3 ± 0.1)×1031 erg s−1. The posterior distributions of ϵe, ϵB and γw are shown in Fig. 5.
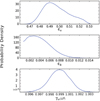 |
Fig. 5. The posterior probability distributions for the free parameters ϵe, ϵB, and γw. |
Comparing the model PWN luminosity with the observed LX (i.e., ∼2 × 1031 erg s−1), they differ by a factor of approximately two. We would like to point out that such discrepancy can be reconciled by the uncertainty on the distance. The observed LX is based on the distance inferred from the radio dispersion measure of J1911 dDM = 1.07 kpc. Lee et al. (2018) have shown that the uncertainty of dispersion-measure-inferred distance is typically ∼40%. As LX ∝ d2, this adds a factor of approximately two to the error budget of LX. Therefore, we cannot exclude the possibility of a PWN origin for the extended X-ray feature of J1911. For better constraints on its distance and hence its energy flux, parallax observations are encouraged.
Besides the PL model, we found that the X-ray spectrum of the J1911 feature can also be described by a thermal bremsstrahlung model. This might suggest a mechanism similar to that proposed for explaining the properties of the tail of Morla (i.e., PSR J0357+3205; Marelli et al. 2013). In such a scenario, the X-ray emission of the feature originates from the shocked insterstellar medium (ISM; Marelli et al. 2013). Assuming a strong shock and an adiabatic index of 5/3, the plasma temperature can be estimated as  , where mp and μ are the proton mass and the molecular weight of the ISM. According to this, the pulsar velocity of vp ∼ 84 km s−1 implies a temperature of the shock-heated plasma of approximately kT ∼ 0.01μ keV. It appears that the difference between this estimate and that inferred from the thermal bremsstrahlung fit (i.e., kT ∼ 6.8 keV) cannot be reconciled by any reasonable choice of μ. In view of this, we do not favor the thermal bremsstrahlung model to describe the X-ray emission of the J1911 feature.
Acknowledgments
JL is supported by BK21 plus Chungnam National University and the National Research Foundation of Korea grant 2016R1A5A1013277; CYH and LCCL are supported by the National Research Foundation of Korea grant 2016R1A5A1013277; JT is supported by the NSFC grants of China under 11573010, U1631103 and 11661161010.
References
- Cheng, K. S., Taam, R. E., & Wang, W. 2006, ApJ, 641, 427 [NASA ADS] [CrossRef] [Google Scholar]
- Chevalier, R. A. 2000, ApJ, 539, 59 [NASA ADS] [CrossRef] [Google Scholar]
- Danilenko, A., Shternin, P., Karpova, A., Zyuzin, D., & Shibanov, Y. 2015, PASA, 32, 38 [Google Scholar]
- Desvigness, G., Caballero, R. N., Lentati, L., et al. 2016, MNRAS, 458, 3341 [NASA ADS] [CrossRef] [Google Scholar]
- Dickey, J. M., & Lockman, F. J. 1990, ARA&A, 28, 215 [NASA ADS] [CrossRef] [MathSciNet] [Google Scholar]
- Goodman, J., & Weare, J. 2010, CAMCS, 5, 65 [Google Scholar]
- Huang, R. H. H., Kong, A. K. H., Takata, J., et al. 2012, ApJ, 760, 92 [NASA ADS] [CrossRef] [Google Scholar]
- Hui, C. Y. 2014, J. Astron. Space Sci., 31, 101 [NASA ADS] [CrossRef] [Google Scholar]
- Hui, C. Y. 2018, RNAAS, 2, 3 [NASA ADS] [Google Scholar]
- Hui, C. Y., & Becker, W. 2006a, A&A, 448, 13 [NASA ADS] [CrossRef] [EDP Sciences] [Google Scholar]
- Hui, C. Y., & Becker, W. 2006b, A&A, 454, 543 [NASA ADS] [CrossRef] [EDP Sciences] [Google Scholar]
- Hui, C. Y., & Becker, W. 2008, A&A, 486, 485 [NASA ADS] [CrossRef] [EDP Sciences] [Google Scholar]
- Hui, C. Y., Lee, J., Kong, A. K. H., et al. 2017, ApJ, 846, 116 [NASA ADS] [CrossRef] [Google Scholar]
- Kalberla, P. M. W., Burton, W. B., Hartmann, D., et al. 2005, A&A, 440, 775 [NASA ADS] [CrossRef] [EDP Sciences] [Google Scholar]
- Kargaltsev, O., Rangelov, B., & Pavlov, G. G. 2013, “The Universe Evolution. Astrophysical and Nuclear Aspects” (Nova Science Publisher, Inc.) [Google Scholar]
- Krautter, J., Zickgraf, F. J., Appenzeller, I., et al. 1999, A&A, 350, 743 [NASA ADS] [Google Scholar]
- Lee, J., Hui, C. Y., Takata, J., et al. 2018, ApJ, 864, 23 [NASA ADS] [CrossRef] [Google Scholar]
- Lorimer, D. R., Lyne, A. G., Bailes, M., et al. 1996, MNRAS, 283, 1383 [NASA ADS] [CrossRef] [Google Scholar]
- Marelli, M., De Luca, A., Salvetti, D., et al. 2013, ApJ, 765, 36 [NASA ADS] [CrossRef] [Google Scholar]
- Monet, D. G., Levine, S. E., Canzian, B., et al. 2003, AJ, 125, 984 [NASA ADS] [CrossRef] [Google Scholar]
- Noutsos, A., Kramer, M., Carr, P., et al. 2012, MNRAS, 423, 2736 [NASA ADS] [CrossRef] [Google Scholar]
- Porth, O., Komissarov, S. S., & Keppens, R. 2013, MNRAS, 431, 48 [Google Scholar]
- Romani, R. W., Slane, P., & Green, A. W. 2017, ApJ, 851, 61 [NASA ADS] [CrossRef] [Google Scholar]
- Skrutskie, M. F., et al. 2006, AJ, 131, 1163 [NASA ADS] [CrossRef] [Google Scholar]
- Stappers, B. W., Gaensler, B. M., Kaspi, V. M., van der Klis, M., & Lewin, W. H. G. 2003, Science, 299, 1372 [NASA ADS] [CrossRef] [PubMed] [Google Scholar]
All Tables
All Figures
|
Fig. 1. Exposure-corrected image of 2′ × 2′ area around PSR J1911–1114 as observed by MOS1/2 in 0.3−10 keV. The blue cross illustrates the radio timing position of J1911. The blue circle shows the point-like X-ray source and all the other white dashed regions illustrate various components of the extended feature. The green arrow represents the proper motion direction of J1911. The scale bar at the bottom is the pixel values in units of photons cm−2 s−1. Black circles indicate the identified optical sources. |
| In the text | |
|
Fig. 2. Top panel: sampling regions of brightness profile (green) and background (white). Bottom panel: brightness profile of the elongated feature. The solid line and dashed horizontal lines are averaged background level and 1σ uncertainties, respectively. Zero in the x-axis is chosen at the radio timing position. The profile expected for a point spread function is illustrated by the dotted line. |
| In the text | |
|
Fig. 3. Binned spectrum of the whole feature associated with J1911 as observed by MOS1/2 with the best estimated PL model overplotted (upper panel) and the fitting residuals (lower panel). |
| In the text | |
|
Fig. 4. 1D marginalized posterior probability distributions of photon index (upper panel) and the plasma temperature (lower panel) as inferred from the non-thermal and thermal scenarios, respectively. |
| In the text | |
|
Fig. 5. The posterior probability distributions for the free parameters ϵe, ϵB, and γw. |
| In the text | |
Current usage metrics show cumulative count of Article Views (full-text article views including HTML views, PDF and ePub downloads, according to the available data) and Abstracts Views on Vision4Press platform.
Data correspond to usage on the plateform after 2015. The current usage metrics is available 48-96 hours after online publication and is updated daily on week days.
Initial download of the metrics may take a while.