Fig. 2.
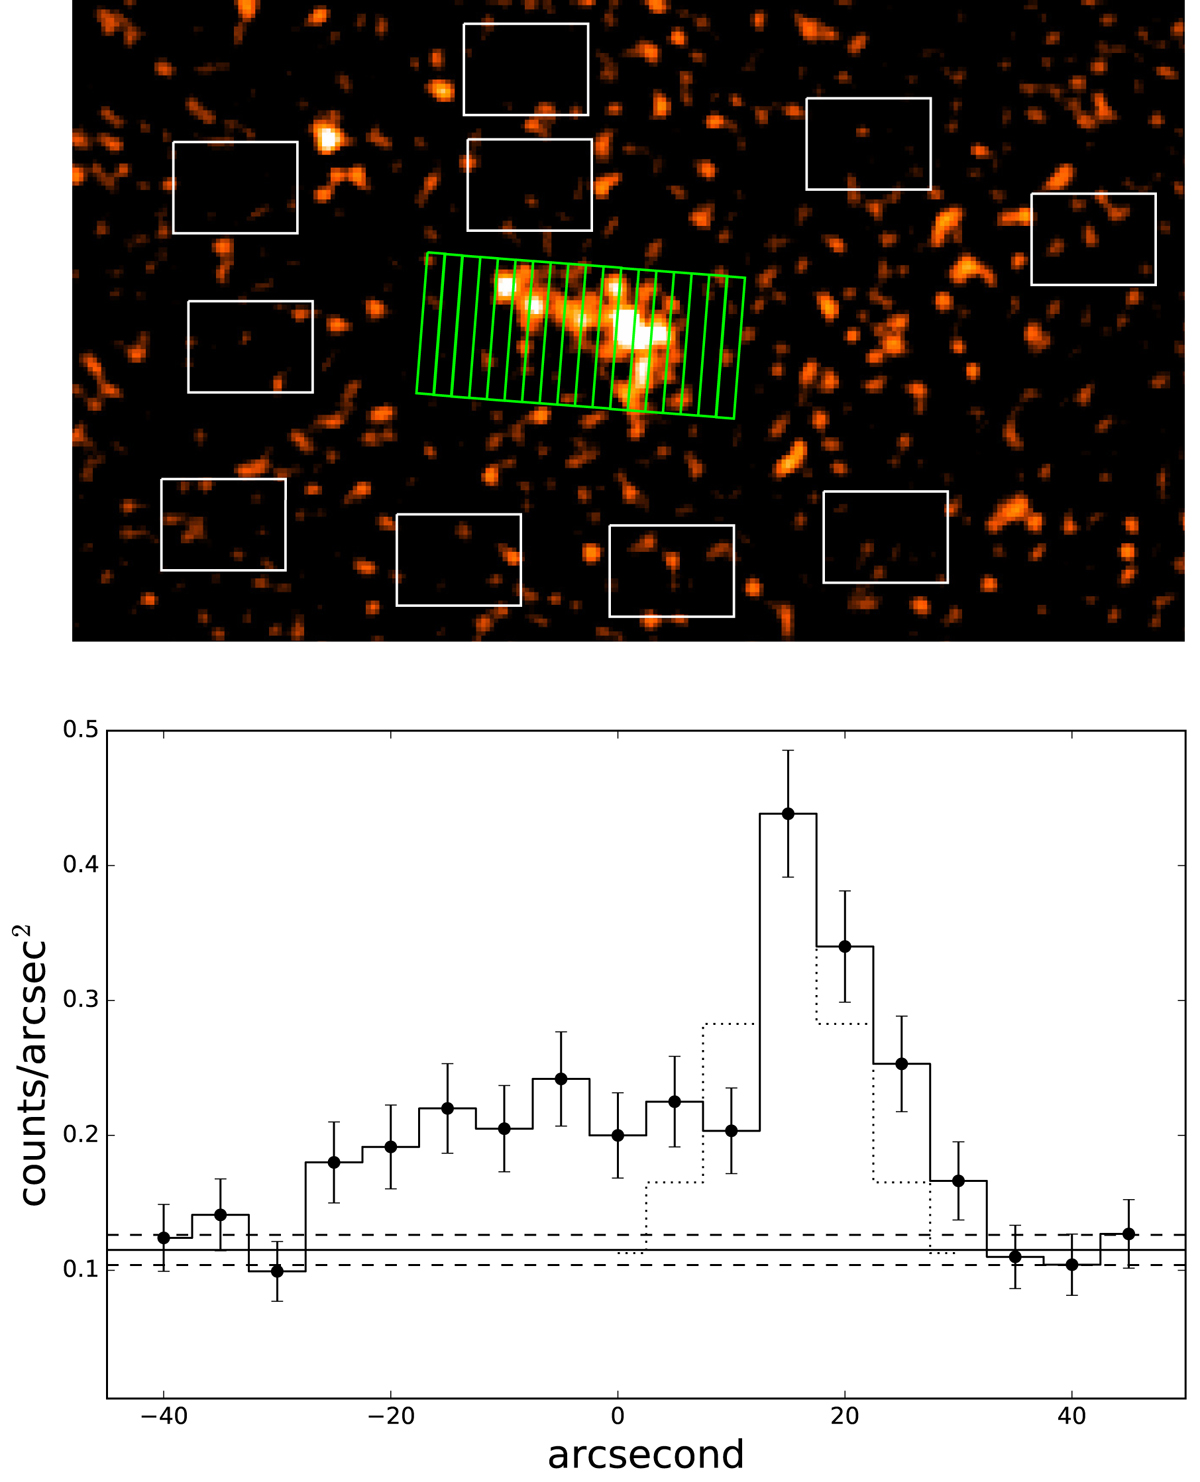
Top panel: sampling regions of brightness profile (green) and background (white). Bottom panel: brightness profile of the elongated feature. The solid line and dashed horizontal lines are averaged background level and 1σ uncertainties, respectively. Zero in the x-axis is chosen at the radio timing position. The profile expected for a point spread function is illustrated by the dotted line.
Current usage metrics show cumulative count of Article Views (full-text article views including HTML views, PDF and ePub downloads, according to the available data) and Abstracts Views on Vision4Press platform.
Data correspond to usage on the plateform after 2015. The current usage metrics is available 48-96 hours after online publication and is updated daily on week days.
Initial download of the metrics may take a while.