Fig. 8
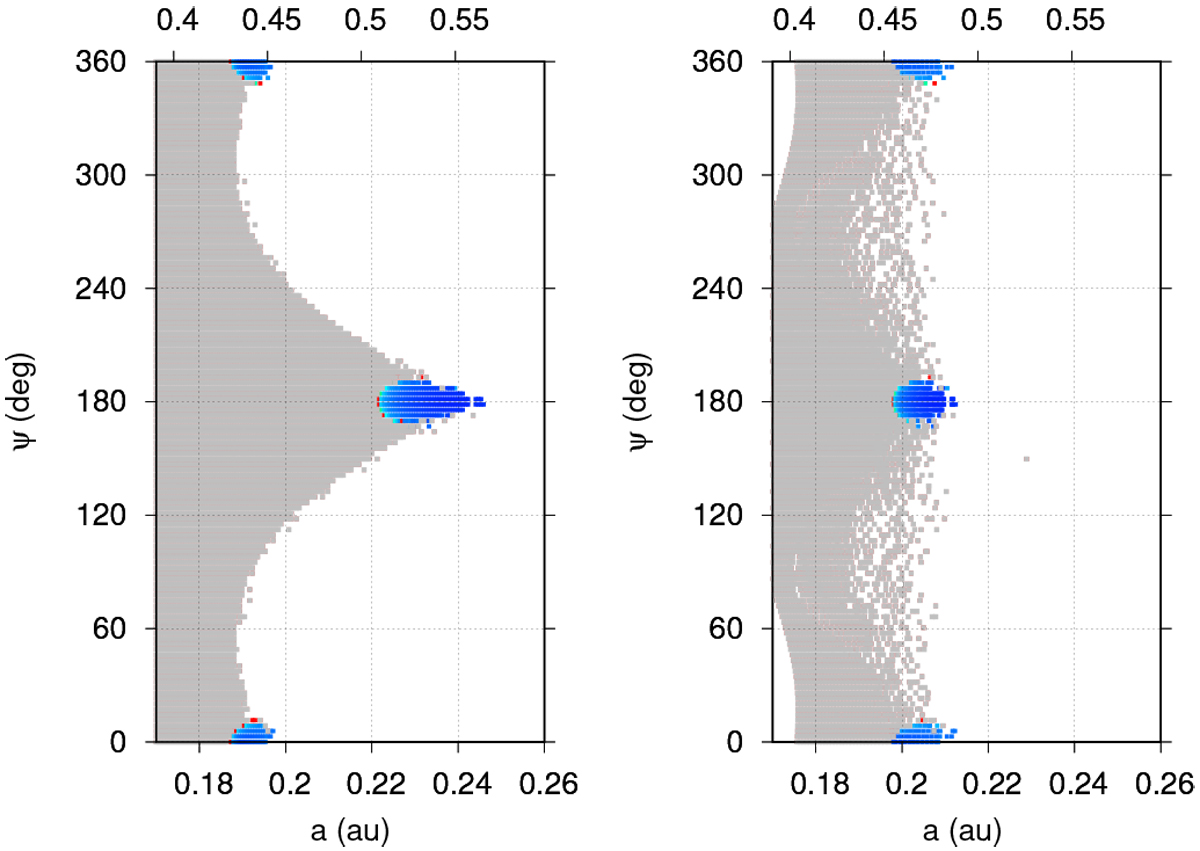
Dynamical maps of the δψ indicator in the (a, ψ)-plane for the outer evection, with initial e = 0.4. The leftpanel corresponds to a grid of osculating elements, while the right panel is the same grid in terms of mean elements. Blue regions represent the conditions for which δ ψ ≲ 30°. Gray regionscorrespond to larger libration amplitudes or circulation of ψ. White regions are unstable orbits. The resonance occurs at a mean semi-major axis ā = 0.205 au. The upper horizontal axis is the distance in terms of RHill.
Current usage metrics show cumulative count of Article Views (full-text article views including HTML views, PDF and ePub downloads, according to the available data) and Abstracts Views on Vision4Press platform.
Data correspond to usage on the plateform after 2015. The current usage metrics is available 48-96 hours after online publication and is updated daily on week days.
Initial download of the metrics may take a while.