Fig. 15
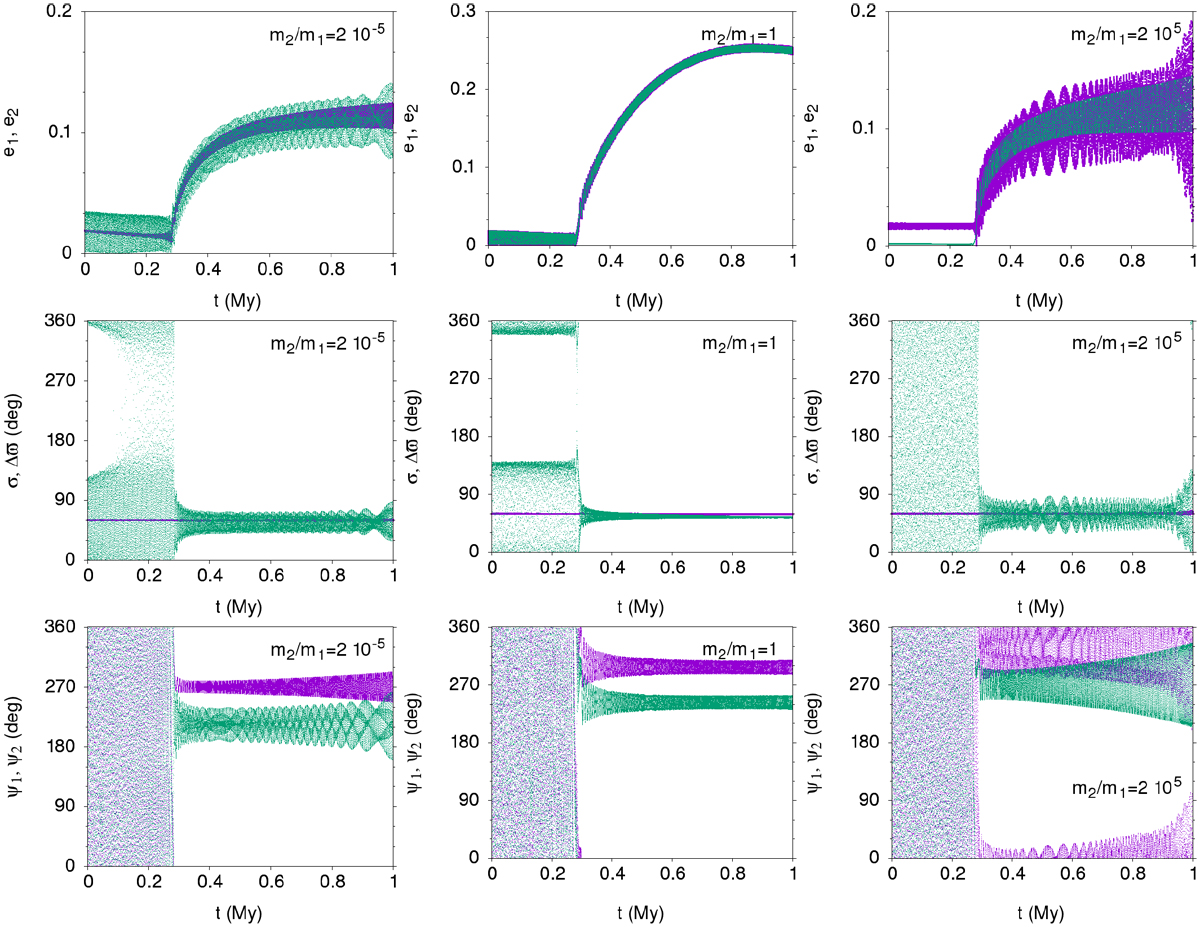
Adiabatic evolution of pair of Trojan satellites that migrate as a result of tidal effects, using Q = 100. Each column of panels corresponds to a different mass ratio m2∕m1: 2 × 10⁻⁵ (left panels),1 (middle panels), and 2 × 10⁵ (right panels). Eccentricity is shown in the top row, σ and Δ ϖ in the middle row, and ψ1, ψ2 in the bottom row. Magenta and green identify identify the trailing and leading Trojan, respectively, except in the middle panels, where they identify σ and Δ ϖ,
Current usage metrics show cumulative count of Article Views (full-text article views including HTML views, PDF and ePub downloads, according to the available data) and Abstracts Views on Vision4Press platform.
Data correspond to usage on the plateform after 2015. The current usage metrics is available 48-96 hours after online publication and is updated daily on week days.
Initial download of the metrics may take a while.