Fig. 7.
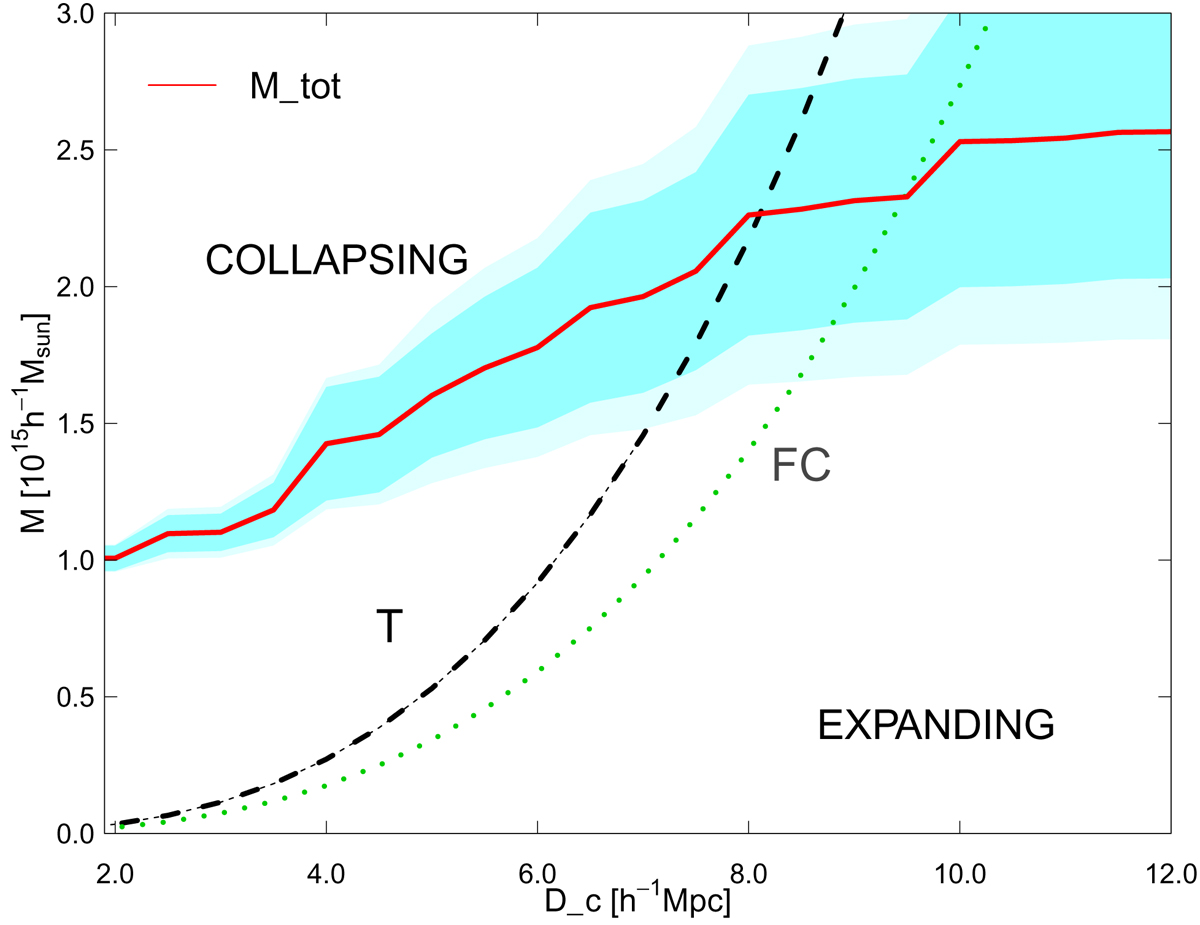
Mass versus clustercentric distance for the main body of SCl 2142. Red solid line shows the total mass within a radius Dc, and shaded areas show error limits as explained in the text. Black and green dotted lines show turnaround (T) and future collapse (FC) mass (MT(R) and MFC(R)) versus radius of a sphere R in a spherical collapse model (Appendix B).
Current usage metrics show cumulative count of Article Views (full-text article views including HTML views, PDF and ePub downloads, according to the available data) and Abstracts Views on Vision4Press platform.
Data correspond to usage on the plateform after 2015. The current usage metrics is available 48-96 hours after online publication and is updated daily on week days.
Initial download of the metrics may take a while.