Fig. 6.
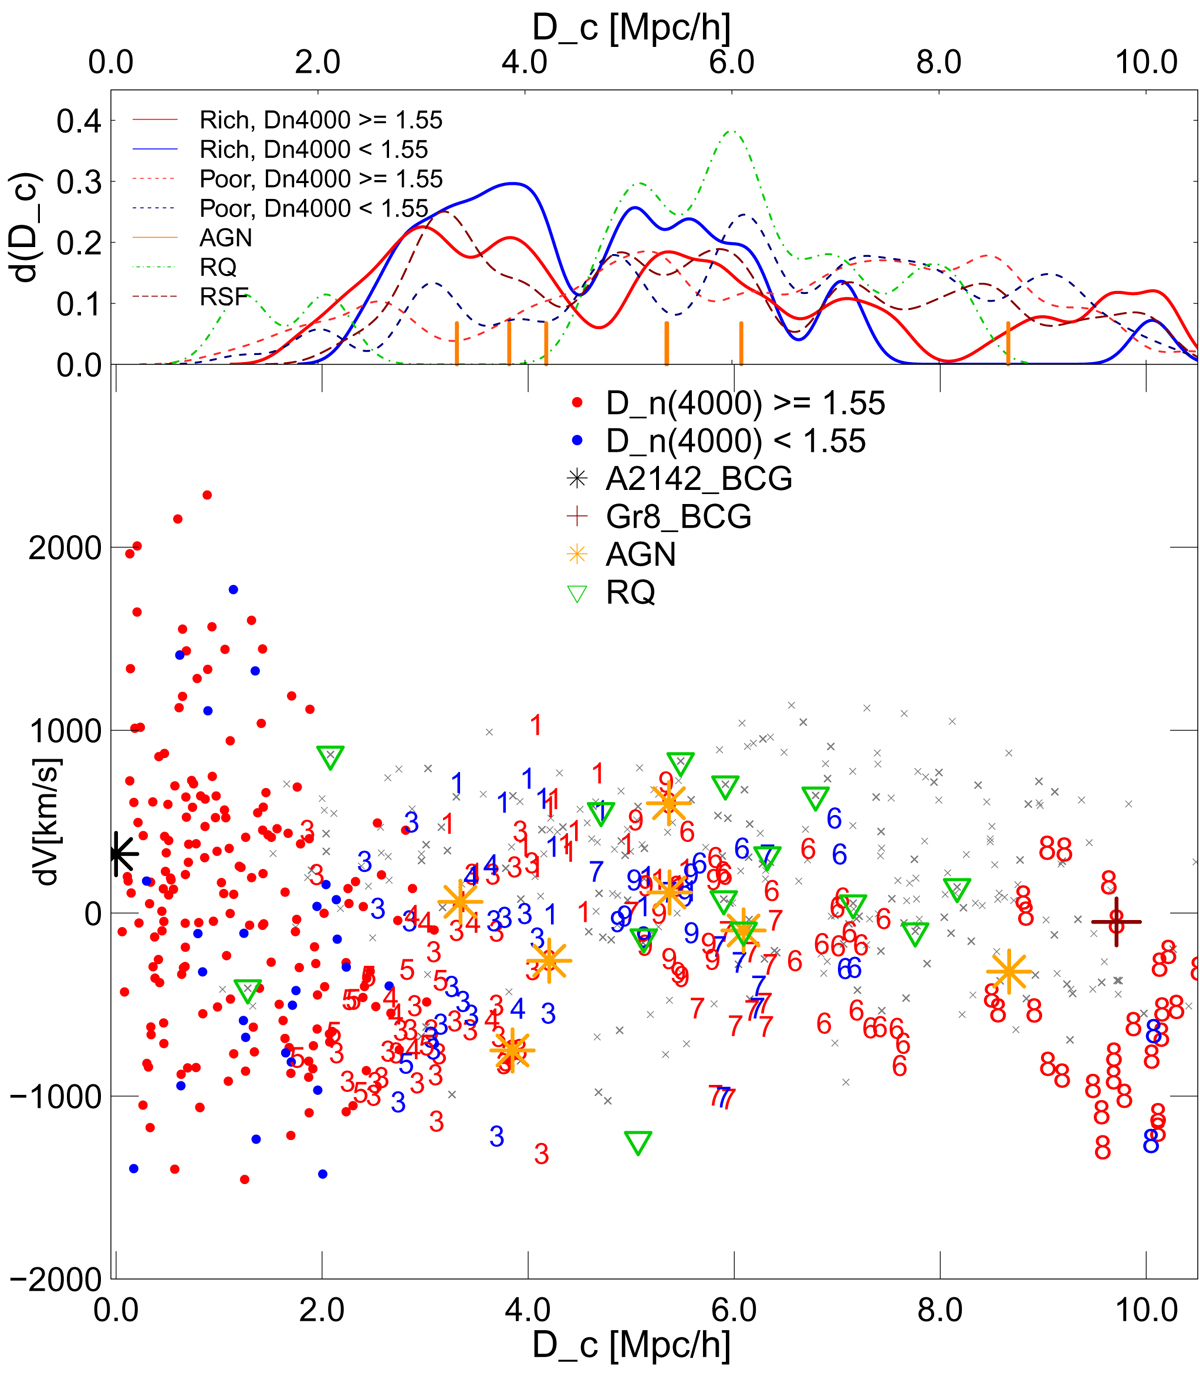
Upper panel: distribution of clustercentric distances for galaxies with young and old stellar populations in rich groups up to clustercentric distances Dc ≤ 10.5 h−1 Mpc (solid lines, Dn(4000)≥1.55), red line, and (Dn(4000)< 1.55, blue line), and in poor groups (dashed red and blue lines). Galaxies from the cluster A2142 are not included when calculating distributions. Green and dark red dashed lines show distribution of clustercentric distances of recently quenched and red star forming galaxies, respectively (see text for definition). Orange ticks show clustercentric distances of AGNs. Lower panel: velocity of galaxies with respect to the cluster mean velocity vs. projected clustercentric distance for the supercluster A2142 main body up to clustercentric distances Dc ≤ 10.5 h−1 Mpc (PPS diagram). The red symbols show galaxies with old stellar populations (Dn(4000)≥1.55), and the blue symbols denote galaxies with young stellar populations (Dn(4000)< 1.55). Filled circles correspond to galaxies in the cluster A2142. Galaxies in other rich groups are plotted with the number which is the order number of a group in Table 1. Grey crosses indicate galaxies in poor groups with 2 − 9 galaxies, and single galaxies. Triangles show recently quenched galaxies, as in Fig. 1.
Current usage metrics show cumulative count of Article Views (full-text article views including HTML views, PDF and ePub downloads, according to the available data) and Abstracts Views on Vision4Press platform.
Data correspond to usage on the plateform after 2015. The current usage metrics is available 48-96 hours after online publication and is updated daily on week days.
Initial download of the metrics may take a while.