Fig. 5.
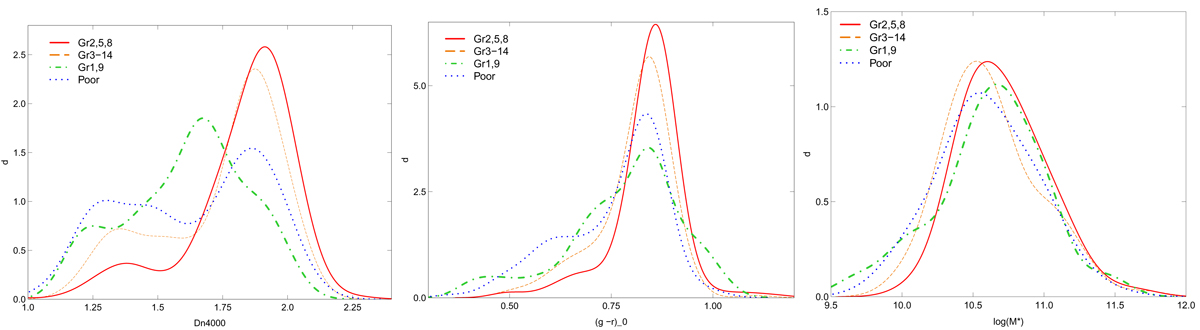
Probability density distributions of Dn(4000) index (left panel), (g − r)0 colour index (middle panel), and stellar masses for galaxies (right panel) in groups 2, 5, and 8 (red solid line), groups 3, 4, 6, 7, and 10 − 14 (notation Gr3-14, orange dashed line), in groups 1 and 9 (green dot-dashed line), and in poor groups (blue dotted line). Group ID numbers are given in Table 1.
Current usage metrics show cumulative count of Article Views (full-text article views including HTML views, PDF and ePub downloads, according to the available data) and Abstracts Views on Vision4Press platform.
Data correspond to usage on the plateform after 2015. The current usage metrics is available 48-96 hours after online publication and is updated daily on week days.
Initial download of the metrics may take a while.