Fig. 4.
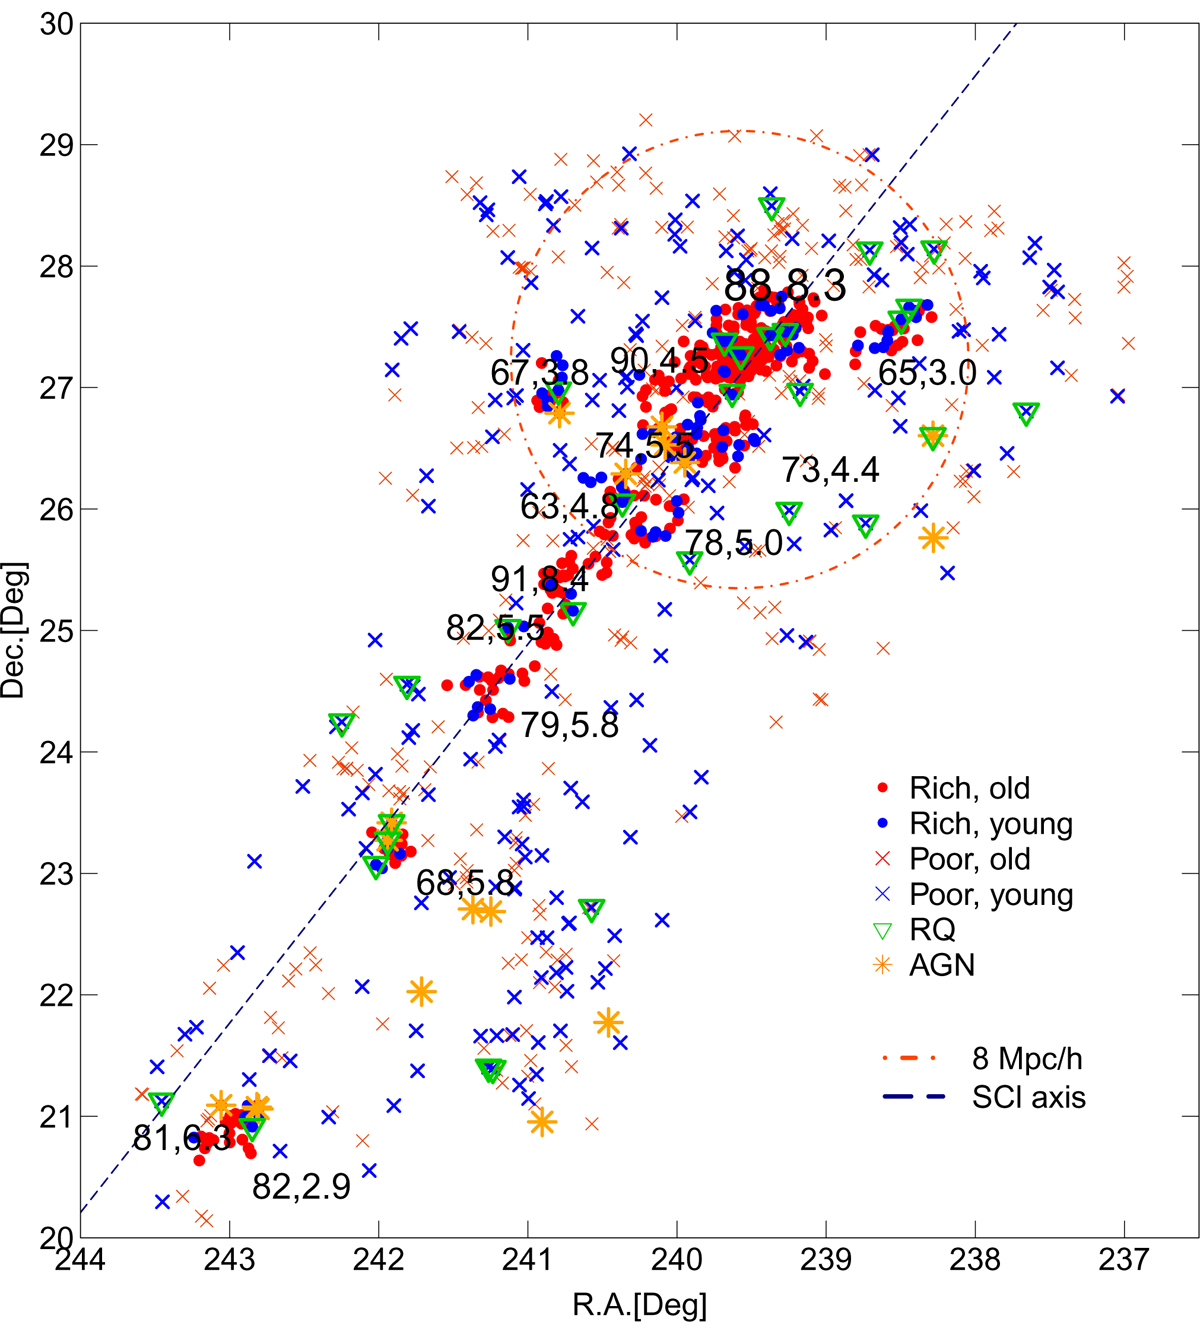
Sky distribution of galaxies in SCl A2142. The red symbols show galaxies with old stellar populations (Dn(4000)≥1.55), and the blue symbols denote galaxies with young stellar populations (Dn(4000)< 1.55). The first number shows the percentage of galaxies with old stellar populations divided by Dn(4000) index in rich groups. The second number shows the median age of galaxy populations in a group (in Gyr, Table 2). Galaxies in rich groups are denoted with filled circles. The crosses denote galaxies in poor groups with 2 − 9 galaxies, and single galaxies. The green triangles show recently quenched galaxies, and orange stars indicate the positions of AGNs. The orange circle has a radius of about 8 h−1 Mpc (in sky projection). The dashed line shows the supercluster axis.
Current usage metrics show cumulative count of Article Views (full-text article views including HTML views, PDF and ePub downloads, according to the available data) and Abstracts Views on Vision4Press platform.
Data correspond to usage on the plateform after 2015. The current usage metrics is available 48-96 hours after online publication and is updated daily on week days.
Initial download of the metrics may take a while.