Fig. A.2.
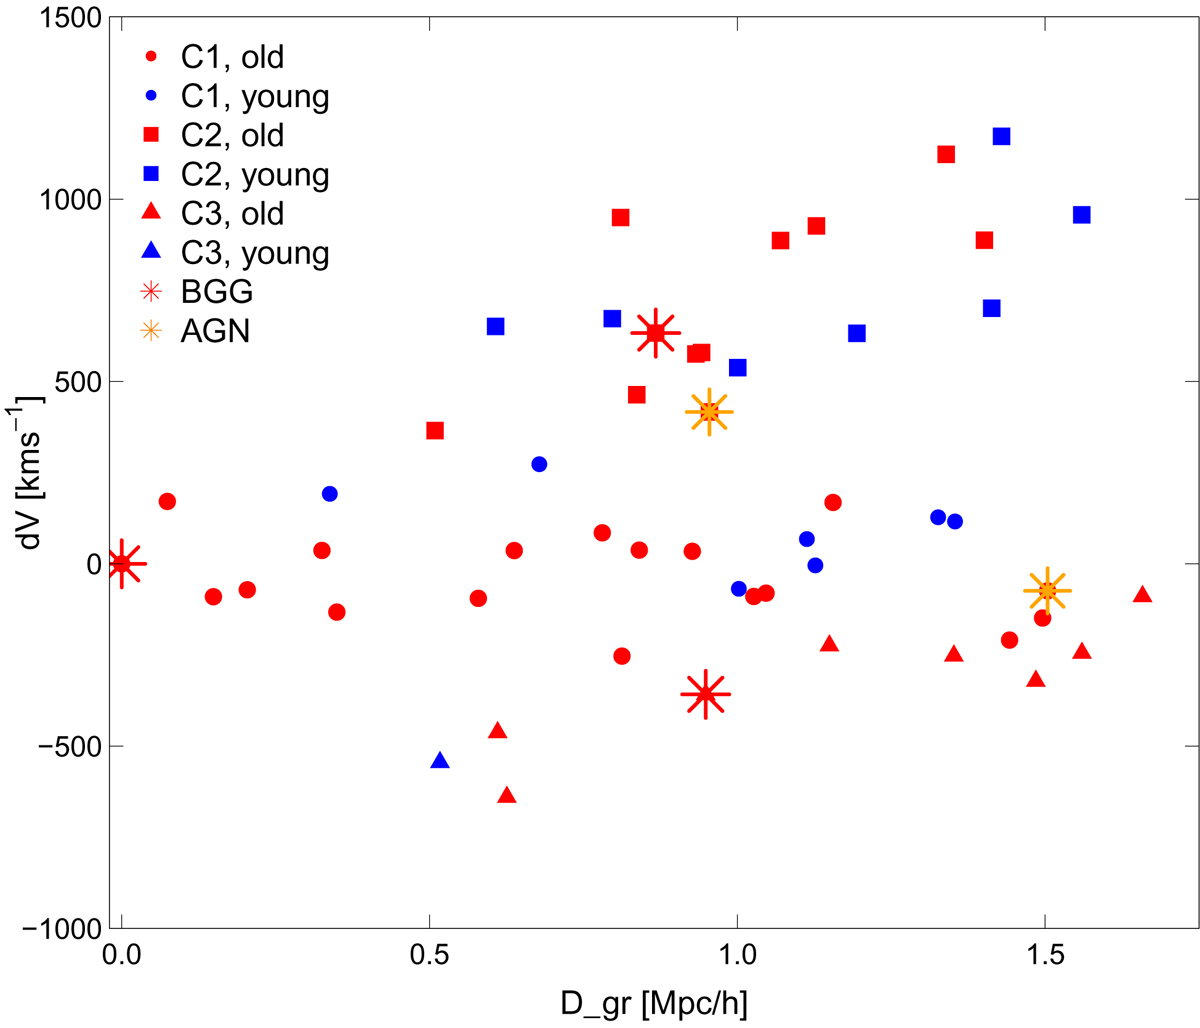
Velocity of galaxies with respect to the group mean velocity vs. the projected distance from the group centre Dgr at the brightest galaxy of the first component in Gr3 (BGG1) for the components of the group Gr3. Red symbols show galaxies with old stellar populations (Dn(4000)≥1.55), and blue symbols denote galaxies with young stellar populations (Dn(4000)< 1.55). Filled circles denote galaxies from the component C1, squares from component C2, and triangles from component C3. Red stars show the location of the BGG of each component, and orange stars correspond to AGNs.
Current usage metrics show cumulative count of Article Views (full-text article views including HTML views, PDF and ePub downloads, according to the available data) and Abstracts Views on Vision4Press platform.
Data correspond to usage on the plateform after 2015. The current usage metrics is available 48-96 hours after online publication and is updated daily on week days.
Initial download of the metrics may take a while.