Fig. 8.
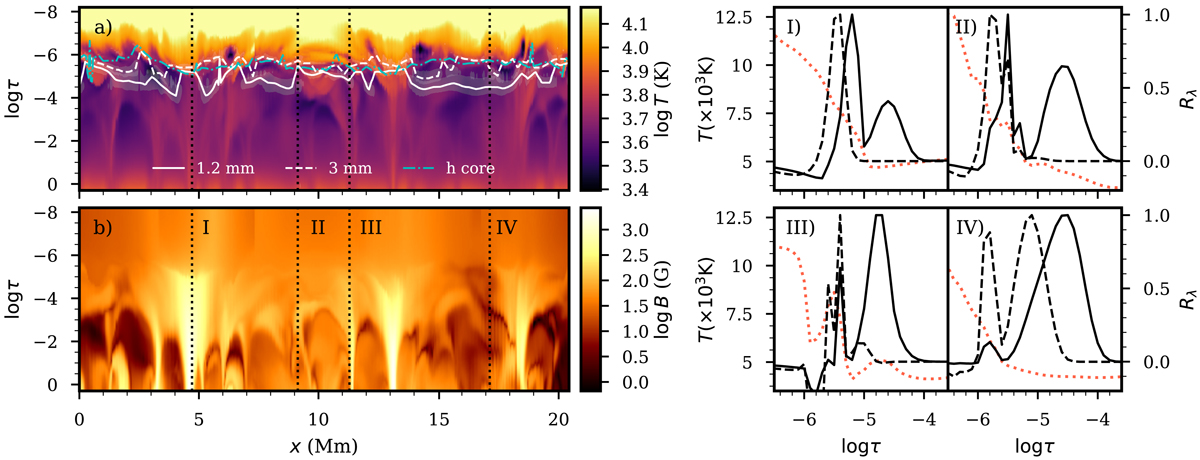
Temperature, response functions to temperature at mm-wavelengths and magnetic field strength in a 2D-cut of a Bifrost simulation. Panel a: temperature (clipped at 15 000 K) as a function of optical depth; the solid and dashed lines are the maximum response in each column at 1.2 mm and 3 mm respectively (smoothed for visibility), and the filled contours enclose the Rλ at half-peak; the peak response the core of Mg II h is shown for comparison (dash-dotted). Panel b: magnetic field strength for context; panels I–IV: normalized response functions of the 1.2 mm- (solid) and 3 mm- (dashed) continuum and temperature profile (dotted line) at the selected columns in panels a,b).
Current usage metrics show cumulative count of Article Views (full-text article views including HTML views, PDF and ePub downloads, according to the available data) and Abstracts Views on Vision4Press platform.
Data correspond to usage on the plateform after 2015. The current usage metrics is available 48-96 hours after online publication and is updated daily on week days.
Initial download of the metrics may take a while.