Fig. 7.
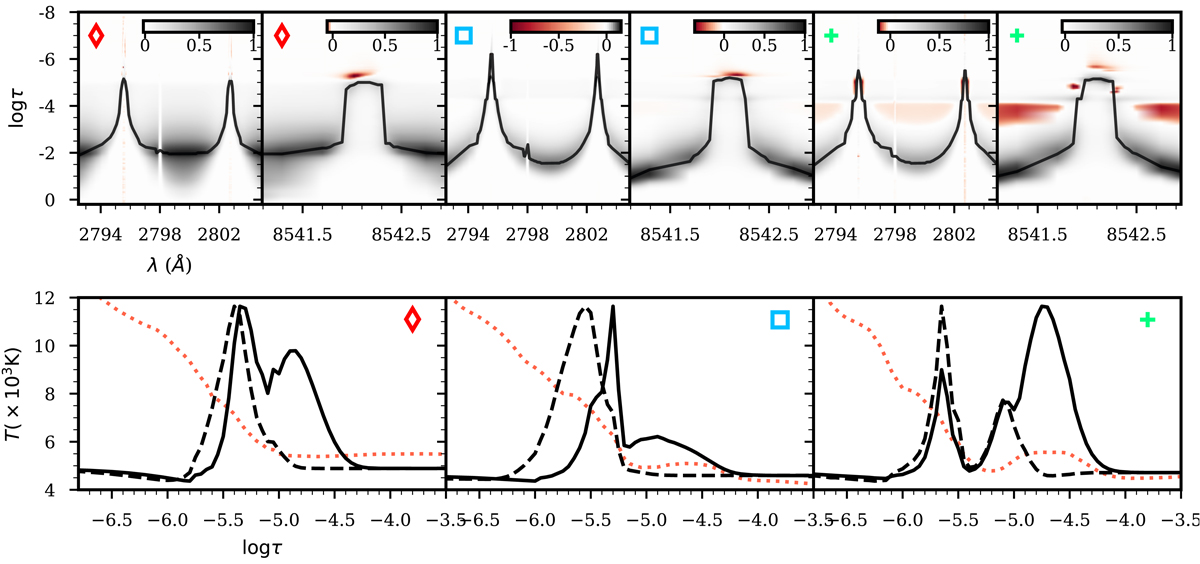
Normalized response functions to temperature perturbations at selected frequencies and pixels in the simulation box. Top row: response functions to temperature of Mg II h and k and Ca II 8542 Å at the same locations given in Fig. 6.; the solid line traces the maximum at each column. Bottom row: normalized responses at 1.2 mm (solid line) and 3 mm (dashed line), and model temperature (dotted line) at those locations.
Current usage metrics show cumulative count of Article Views (full-text article views including HTML views, PDF and ePub downloads, according to the available data) and Abstracts Views on Vision4Press platform.
Data correspond to usage on the plateform after 2015. The current usage metrics is available 48-96 hours after online publication and is updated daily on week days.
Initial download of the metrics may take a while.