Fig. 2.
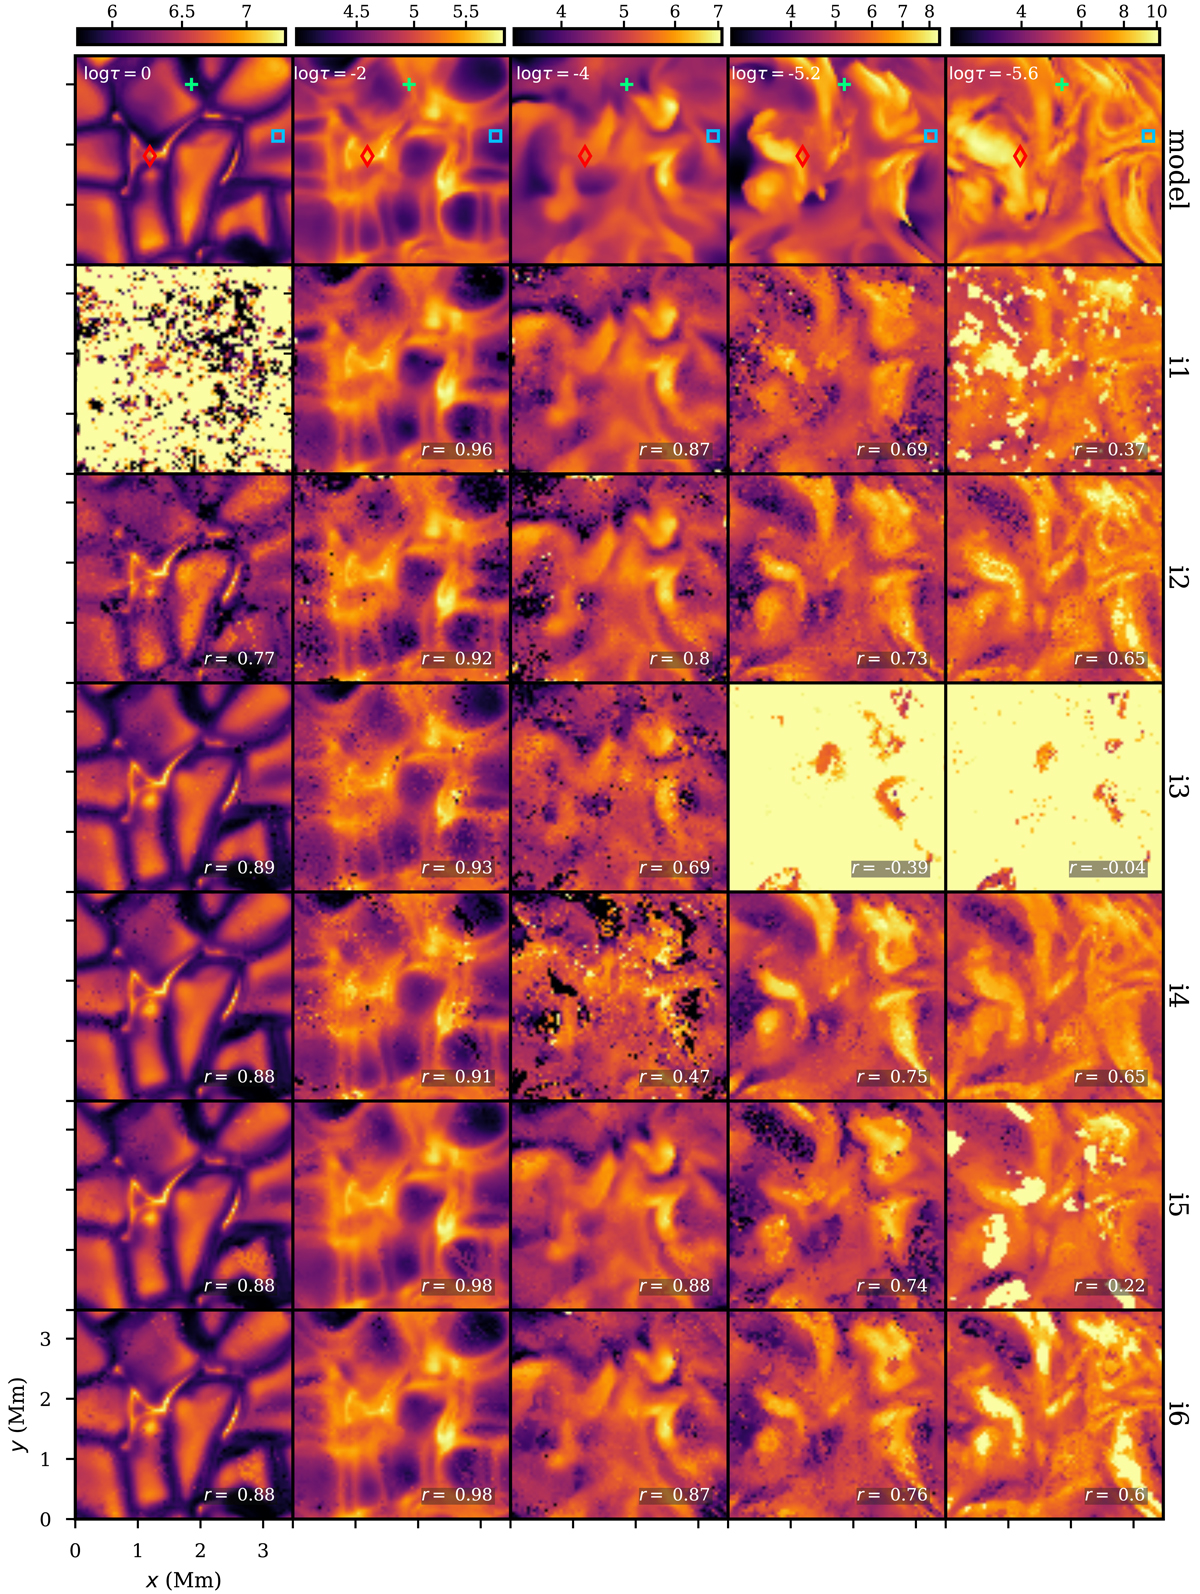
Inverted temperatures compared to the model. Each column corresponds to a given optical depth and each row to a different inversion scheme (not smoothed) which is to be compared to the model in the top row. The colorbars are in units of 103 K. The three markers in the top row correspond to the spectra in Fig. 6. r is the Pearson’s correlation coefficient.
Current usage metrics show cumulative count of Article Views (full-text article views including HTML views, PDF and ePub downloads, according to the available data) and Abstracts Views on Vision4Press platform.
Data correspond to usage on the plateform after 2015. The current usage metrics is available 48-96 hours after online publication and is updated daily on week days.
Initial download of the metrics may take a while.