Fig. A.2.
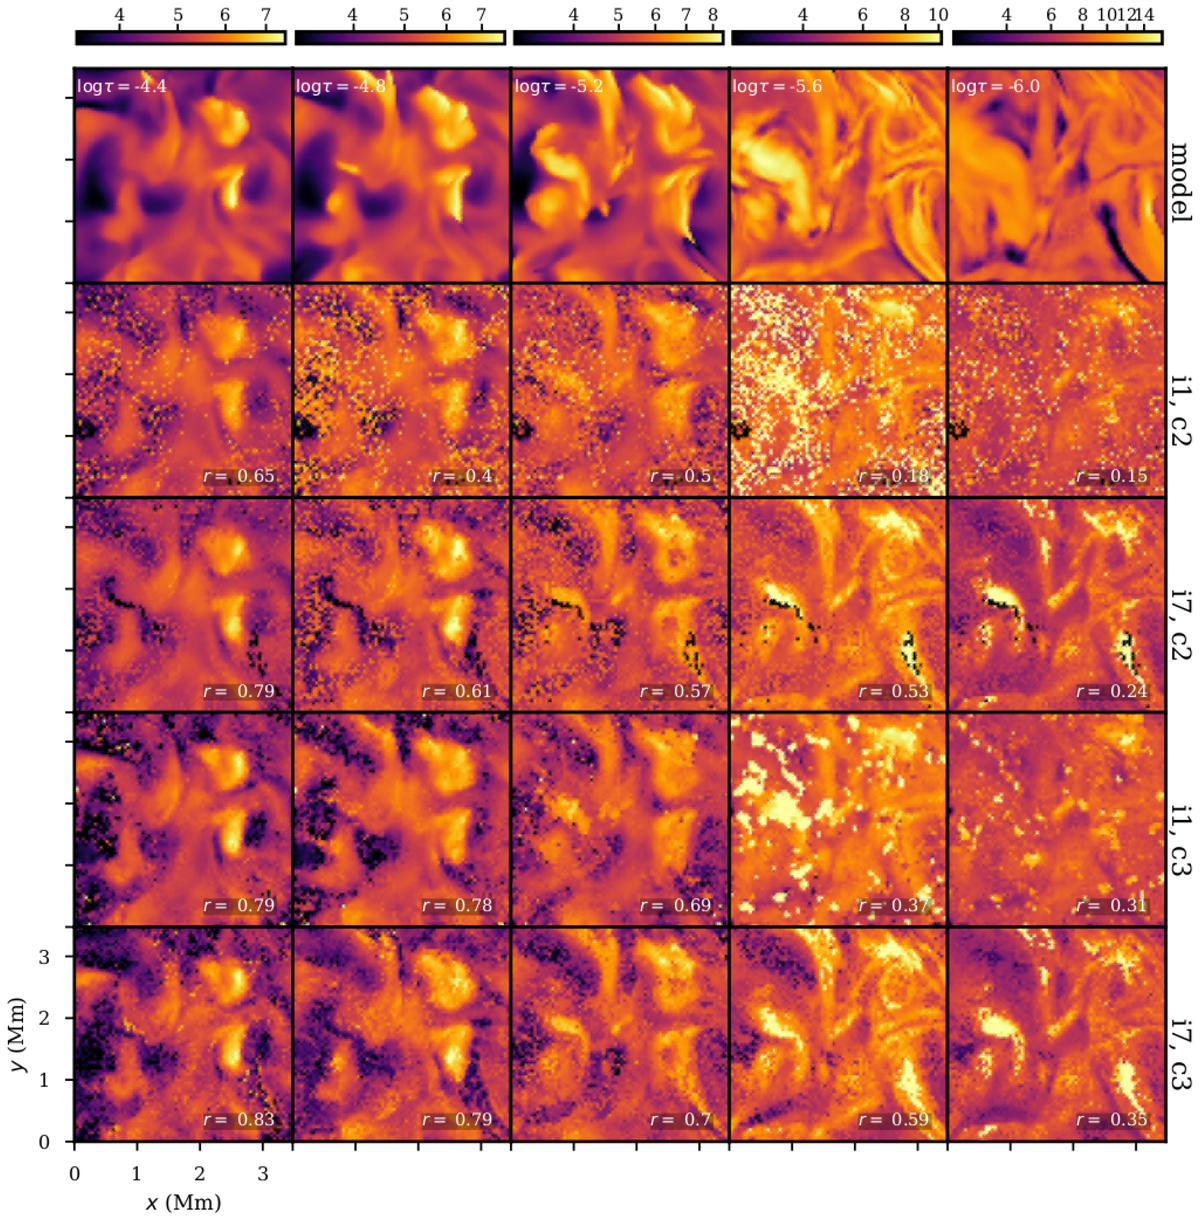
Model and inverted temperatures as function of optical depth in a patch of a Bifrost simulation snapshot. Top row: temperature in the model at selected optical depths in the chromosphere; we compare the schemes i1 and i7 for cycle 2 (10 temperature nodes) and cycle 3 (14 temperature nodes). The colorbars are in units of 103 K. r is the correlation coefficient.
Current usage metrics show cumulative count of Article Views (full-text article views including HTML views, PDF and ePub downloads, according to the available data) and Abstracts Views on Vision4Press platform.
Data correspond to usage on the plateform after 2015. The current usage metrics is available 48-96 hours after online publication and is updated daily on week days.
Initial download of the metrics may take a while.