Fig. 12.
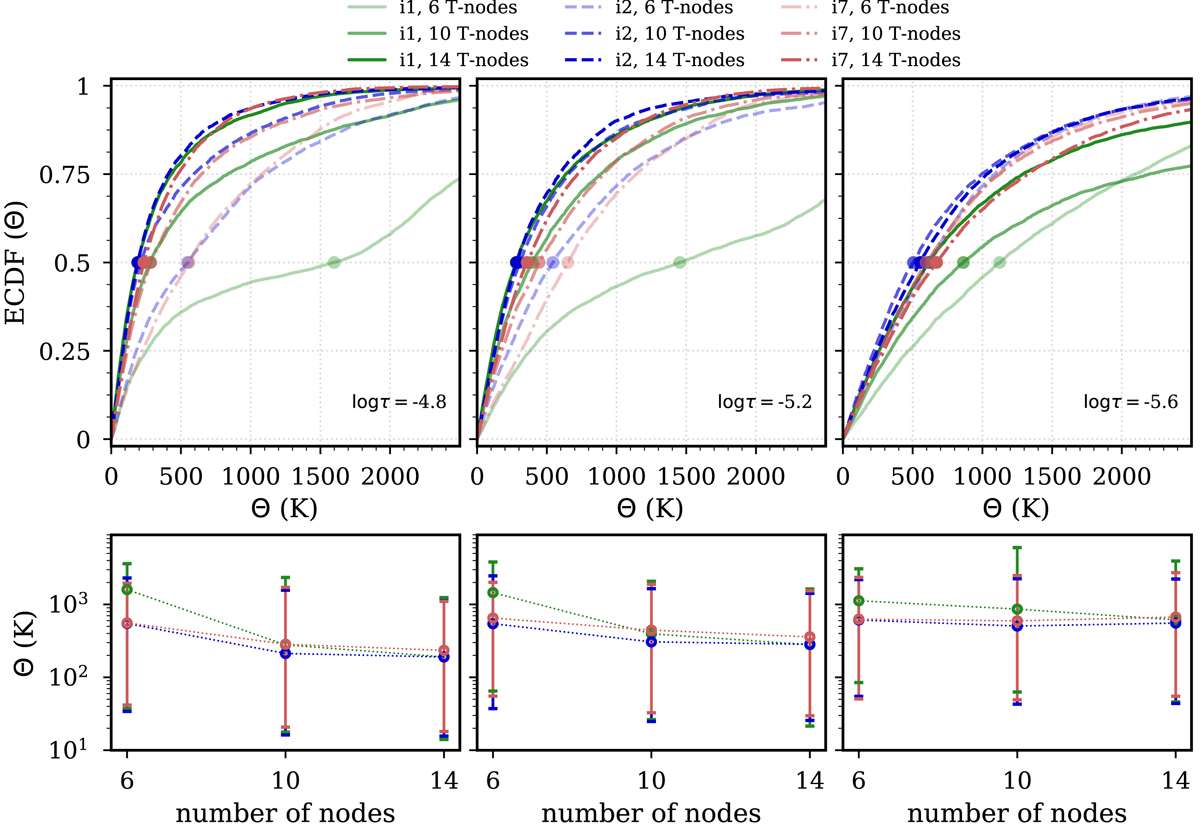
Temperature residuals versus number of nodes for different inversion schemes. Top row: empirical cumulative distribution functions of the absolute residuals Eq. (3) of the schemes i1 (solid green), i2 (dashed blue) and i7 (dashed-dot red) for different number of temperature nodes at three selected optical depths in the chromosphere; bottom row: corresponding median (circle markers) and the interval (vertical lines) containing 90% of the distribution of absolute residuals.
Current usage metrics show cumulative count of Article Views (full-text article views including HTML views, PDF and ePub downloads, according to the available data) and Abstracts Views on Vision4Press platform.
Data correspond to usage on the plateform after 2015. The current usage metrics is available 48-96 hours after online publication and is updated daily on week days.
Initial download of the metrics may take a while.