Fig. 1.
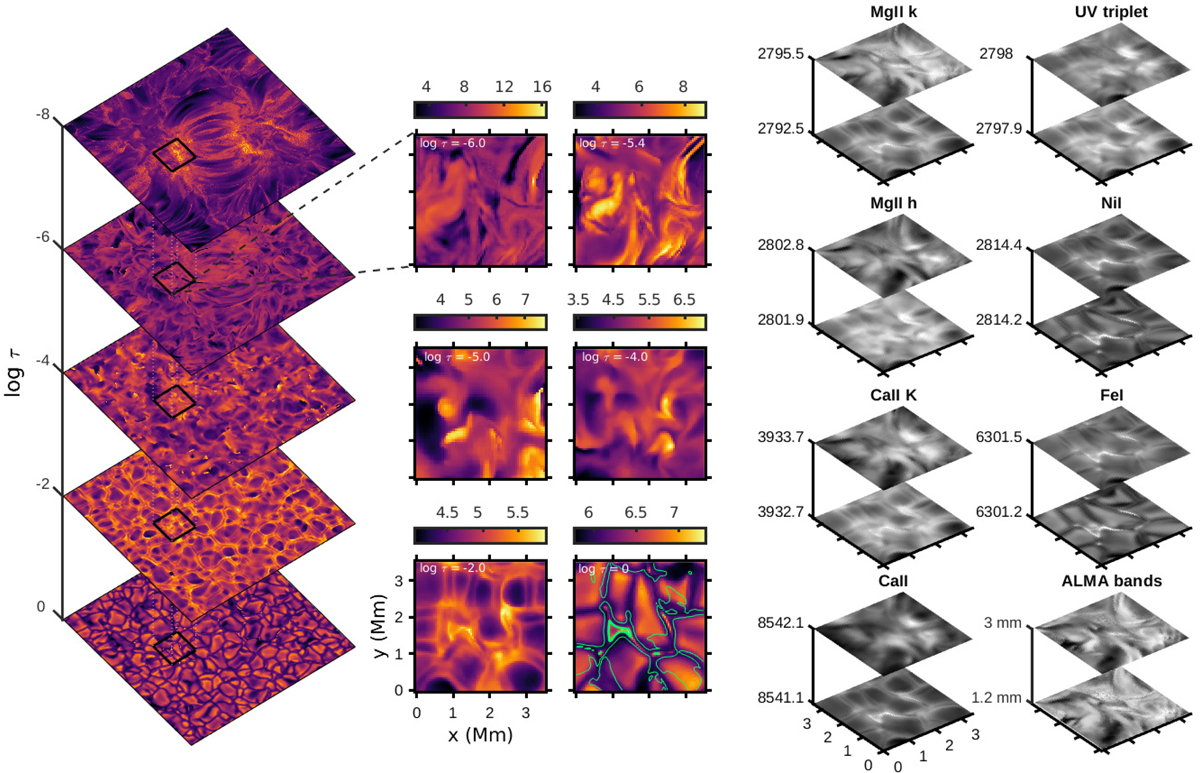
Temperature structure and emerging intensities from a Bifrost simulation. Left panel: gas temperature as function of optical depth; central panel: subregion selected for the inversions with temperature scale in units of 103 K; the magnetic field strength at log τ = 0 is represented by thick (2 kG) and thin (0.1 kG) green isocontours. Right panels: emerging intensities at selected wavelengths given in ångströms except where indicated; for each spectral line, the top and bottom images correspond to core and blue wing wavelengths respectively.
Current usage metrics show cumulative count of Article Views (full-text article views including HTML views, PDF and ePub downloads, according to the available data) and Abstracts Views on Vision4Press platform.
Data correspond to usage on the plateform after 2015. The current usage metrics is available 48-96 hours after online publication and is updated daily on week days.
Initial download of the metrics may take a while.