Fig. 7.
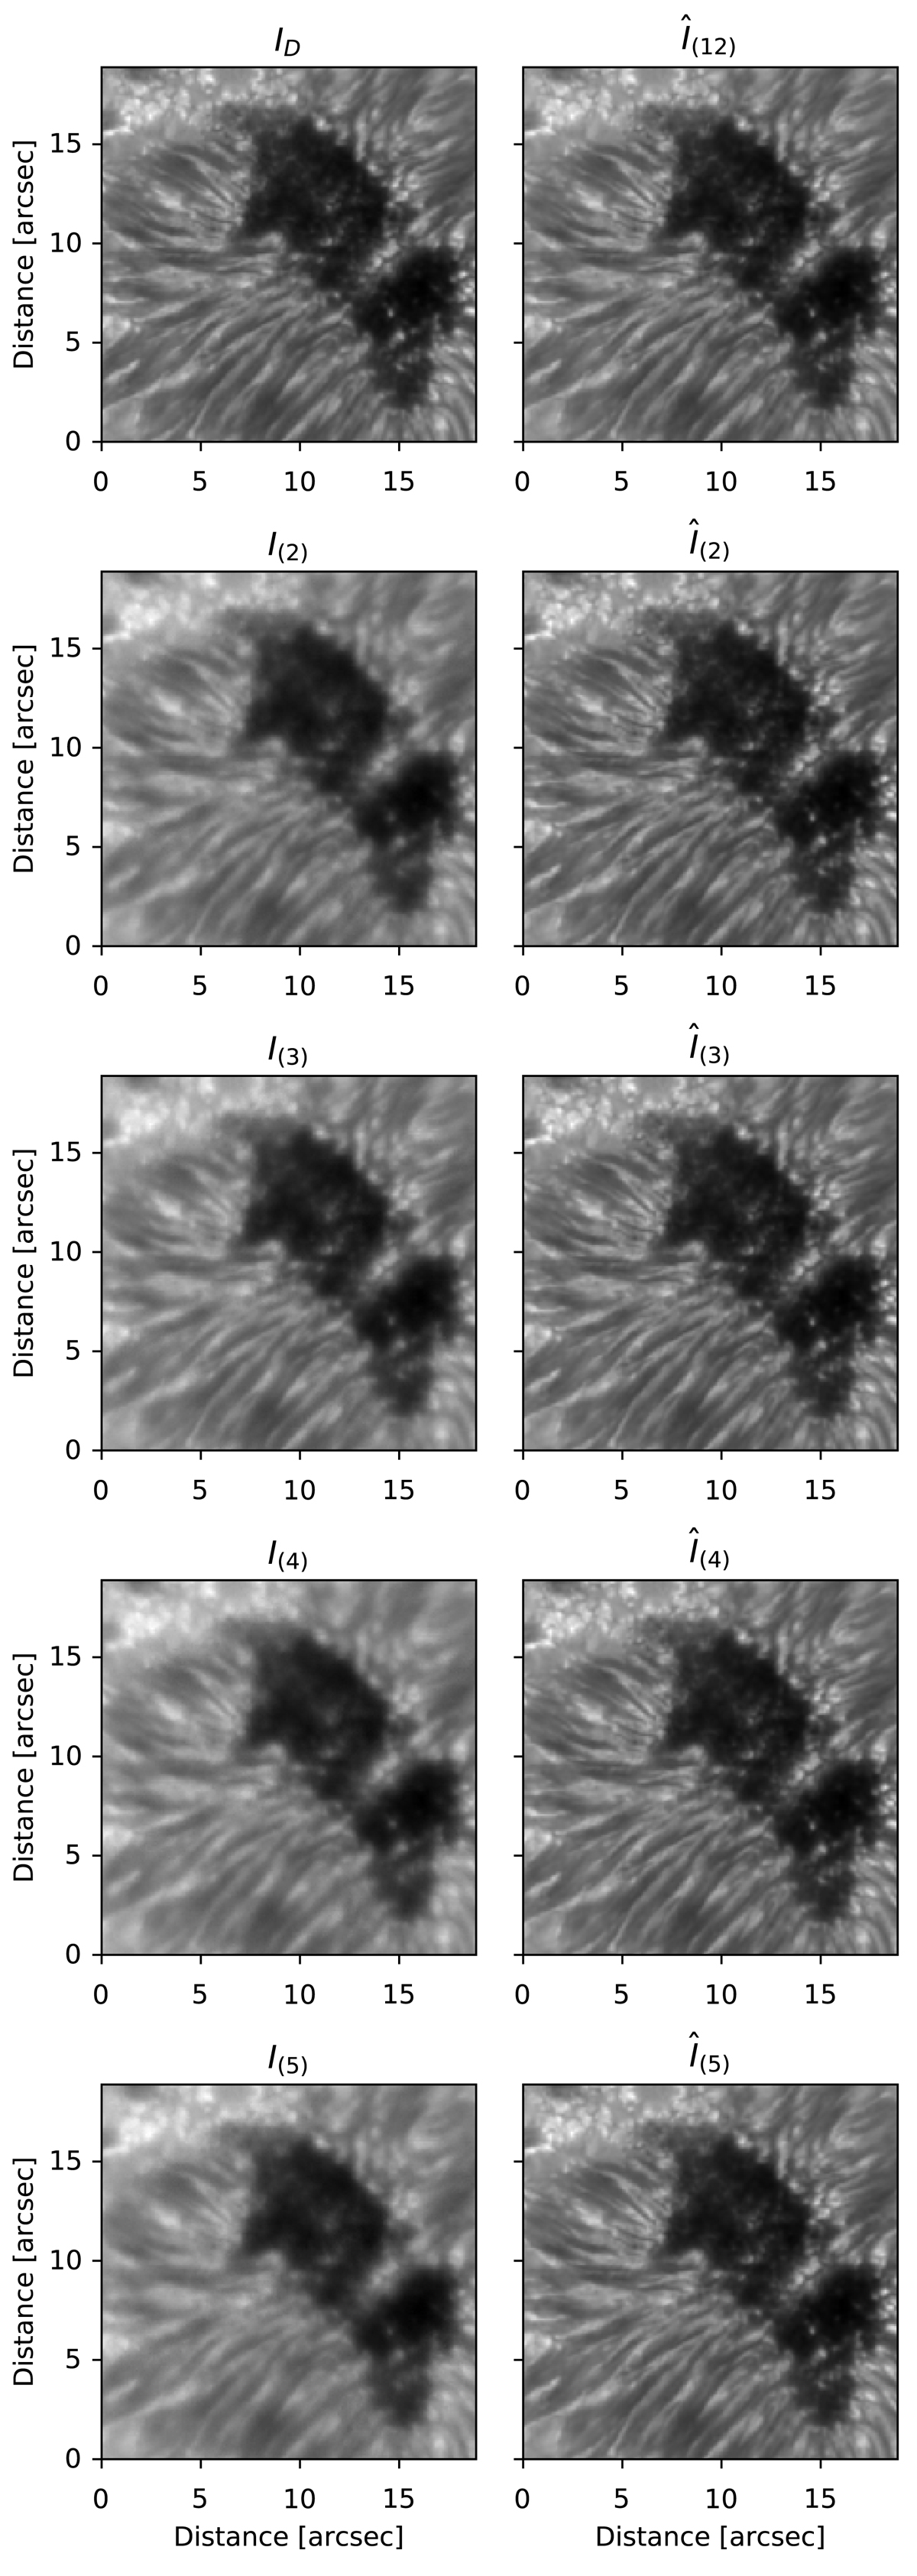
Top row: comparison of the monochromatic image at the core of the Fe I 6173 Å spectral line for MOMFBD (left), equivalently ID in our notation, and the output of the recurrent network after all the 12 frames are considered (right), equivalently, ![]() . Next rows: comparison between individual frames before and after the network reconstruction. We start from frame 2, where we have already used the first two observed frames.
. Next rows: comparison between individual frames before and after the network reconstruction. We start from frame 2, where we have already used the first two observed frames.
Current usage metrics show cumulative count of Article Views (full-text article views including HTML views, PDF and ePub downloads, according to the available data) and Abstracts Views on Vision4Press platform.
Data correspond to usage on the plateform after 2015. The current usage metrics is available 48-96 hours after online publication and is updated daily on week days.
Initial download of the metrics may take a while.