Fig. 6.
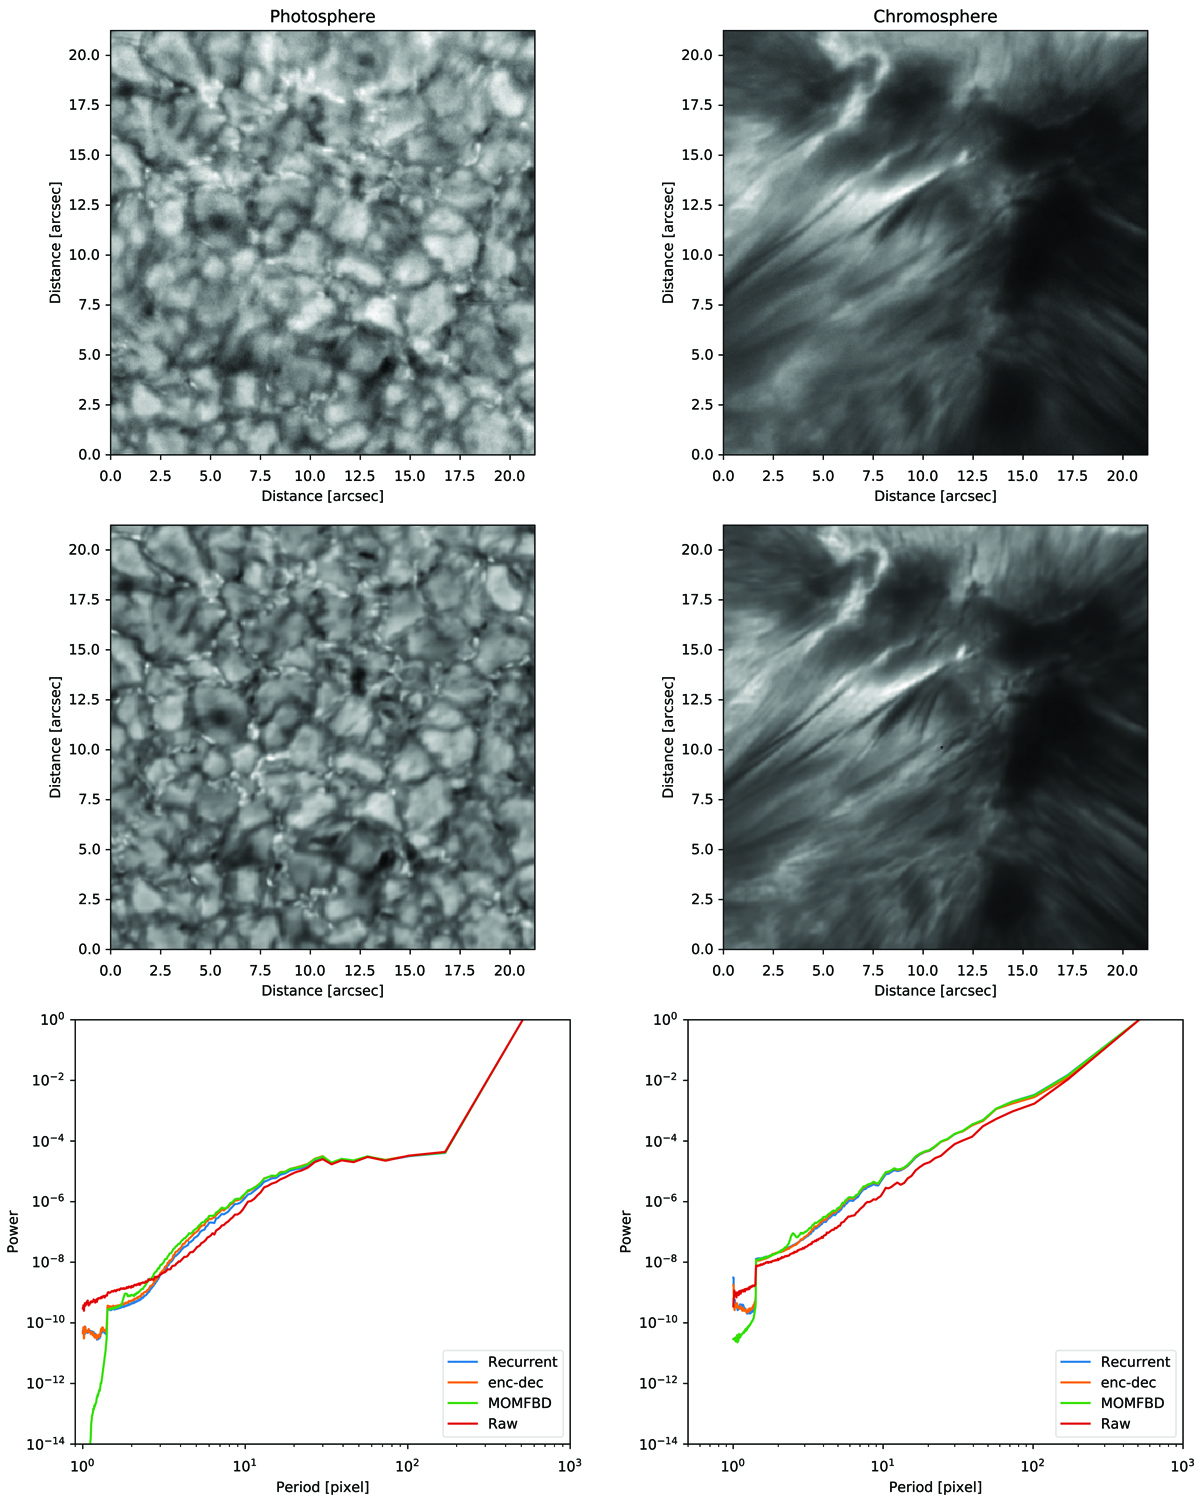
Top panels: single raw image from the burst. Middle panels: reconstructed frames with the recurrent network. Lower panels: azimuthally averaged Fourier power spectra of the images. Left column: results from the continuum image at 6302 Å. Right column: results at the core of the 8542 Å line. All power spectra have been normalized to the value at the largest period (but not shown in the plot because it is outside the displayed range).
Current usage metrics show cumulative count of Article Views (full-text article views including HTML views, PDF and ePub downloads, according to the available data) and Abstracts Views on Vision4Press platform.
Data correspond to usage on the plateform after 2015. The current usage metrics is available 48-96 hours after online publication and is updated daily on week days.
Initial download of the metrics may take a while.