Free Access
Fig. 2.
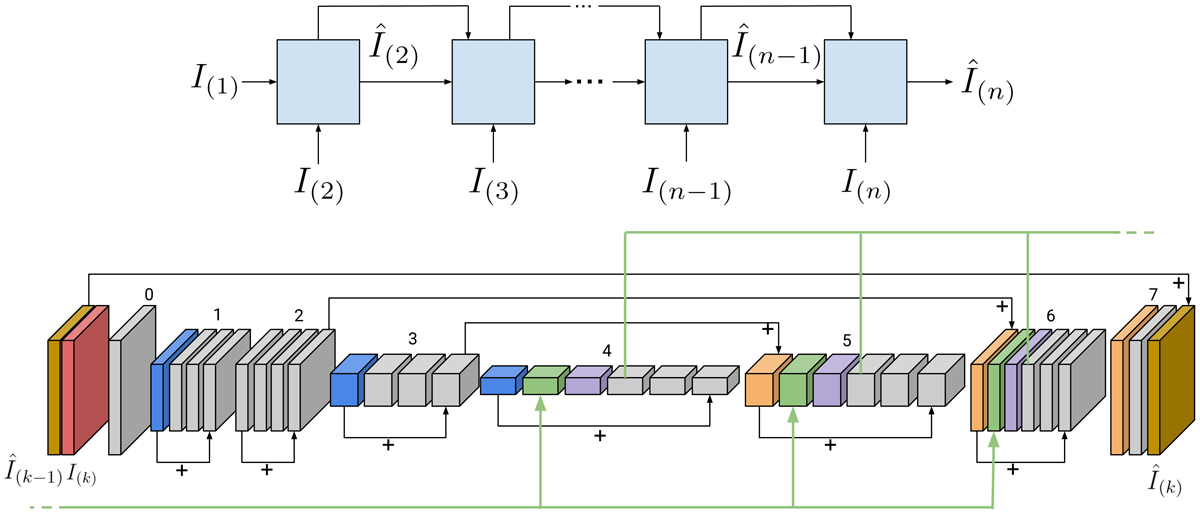
Upper panel: end-to-end deconvolution process, where the gray blocks are the deconvolution blocks described in the lower panel. Lower panel: internal architecture of each deconvolution block. Colors for the blocks are described in Sect. 2.2, with the specific details for each block being described in Table 2.
Current usage metrics show cumulative count of Article Views (full-text article views including HTML views, PDF and ePub downloads, according to the available data) and Abstracts Views on Vision4Press platform.
Data correspond to usage on the plateform after 2015. The current usage metrics is available 48-96 hours after online publication and is updated daily on week days.
Initial download of the metrics may take a while.