Fig. 7.
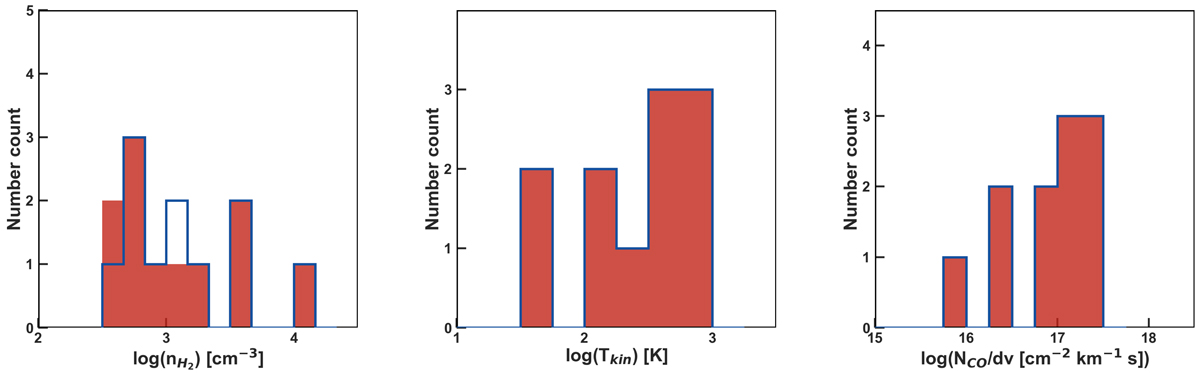
Results of the gas excitation analysis with RADEX. Red histograms show the median values of the marginal probability distributions of nH2, Tk and NCO/dv obtained by modeling the CO SLEDs with a single excitation component (see Table 3). Blue histograms illustrate how results change when removing the CO(1–0) fluxes from the analysis.
Current usage metrics show cumulative count of Article Views (full-text article views including HTML views, PDF and ePub downloads, according to the available data) and Abstracts Views on Vision4Press platform.
Data correspond to usage on the plateform after 2015. The current usage metrics is available 48-96 hours after online publication and is updated daily on week days.
Initial download of the metrics may take a while.