Fig. 6.
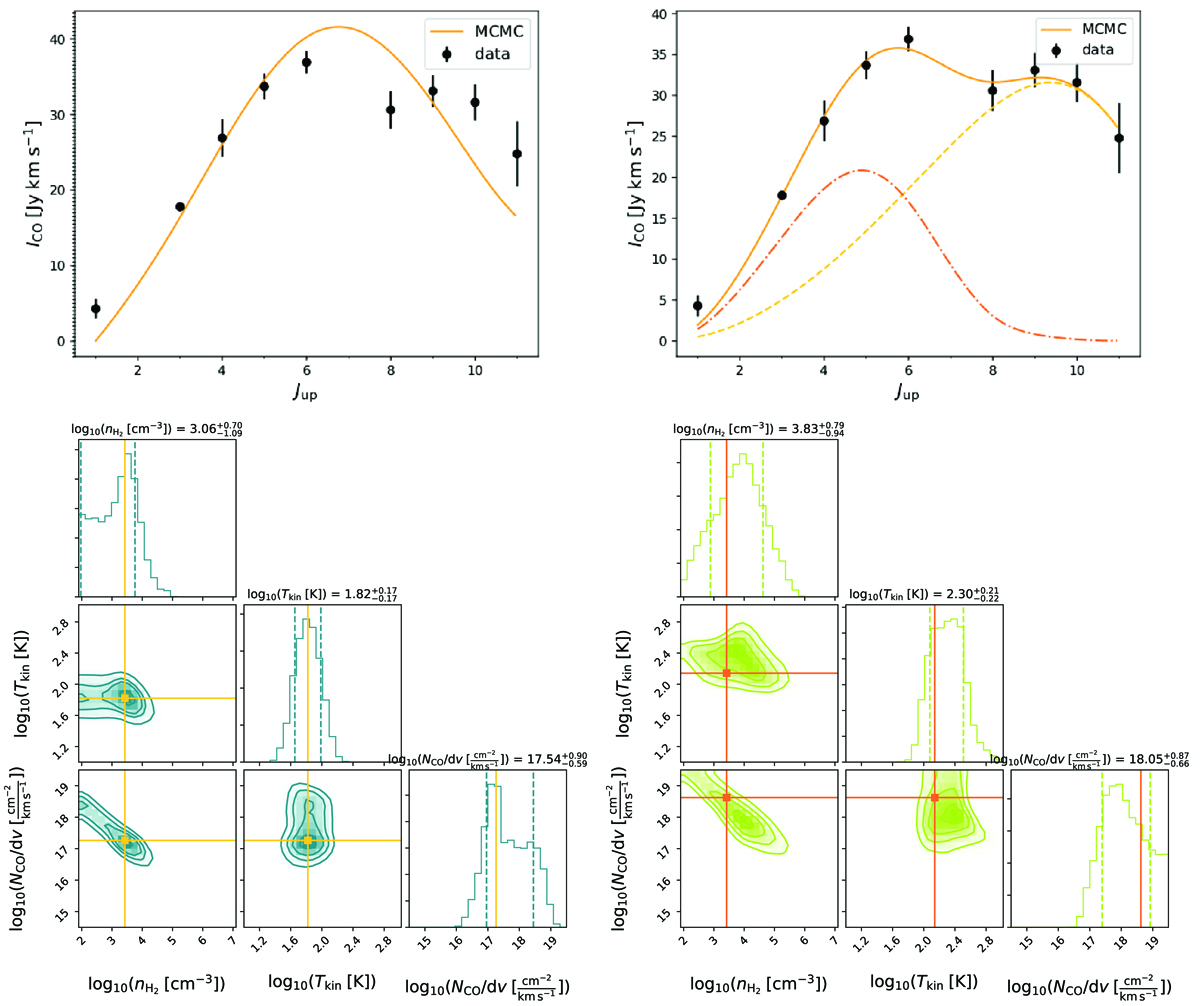
Top left: observed CO SLED of PLCK_G244.8+54.9, the Ruby (black points), without correcting the velocity-integrated fluxes for gravitational magnification. The orange line shows the best-fit model with RADEX using a single gas excitation component, and illustrates a case where this simple model poorly reproduces the CO ladder for Jup ≳ 6. Top right: best-fit model from RADEX using two gas excitation components (solid orange line). The dot-dashed orange line shows the low excitation component, which is assumed to be cooler and more extended than the high excitation component (dashed yellow line) in the analysis. Bottom: one-dimensional and joint two-dimensional posterior probability distributions of nH2, Tk and NCO/dv, obtained from our MCMC sampling of the RADEX parameter space in the two-component model, for the low (left) and high (right) excitation components. Contours increase in steps of 0.5σ. Yellow and orange solid lines show the maximum posterior probability of each parameter, while dotted lines mark the ±1σ range in the distributions. The resulting parameter values are listed above the corresponding histograms.
Current usage metrics show cumulative count of Article Views (full-text article views including HTML views, PDF and ePub downloads, according to the available data) and Abstracts Views on Vision4Press platform.
Data correspond to usage on the plateform after 2015. The current usage metrics is available 48-96 hours after online publication and is updated daily on week days.
Initial download of the metrics may take a while.