Fig. 2.
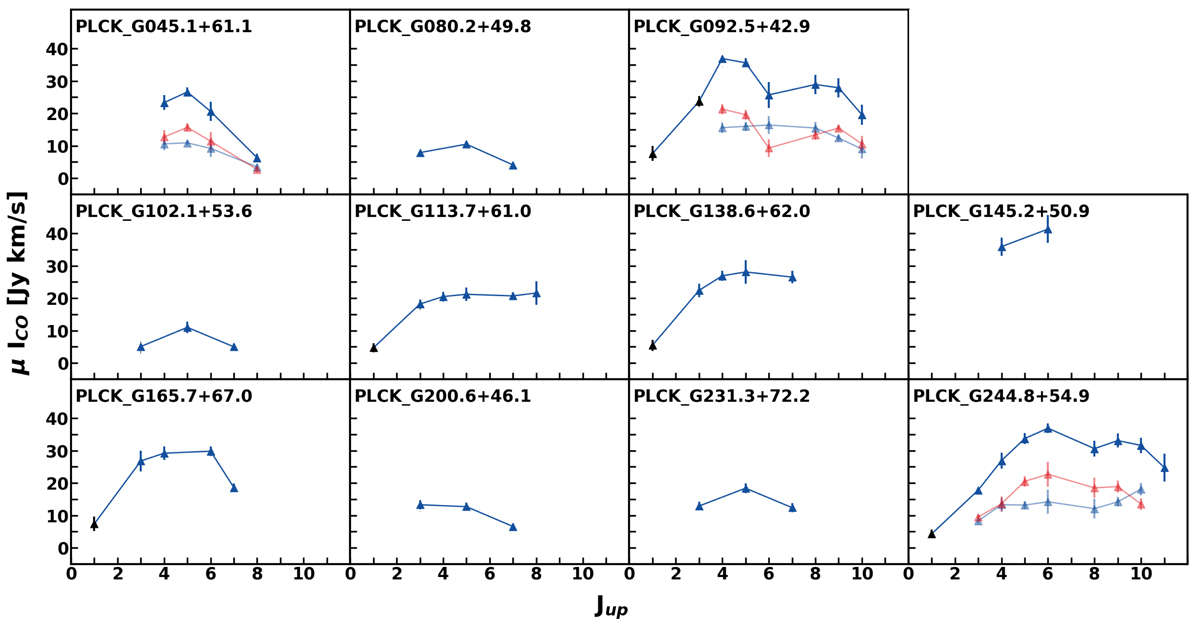
CO spectral-line energy distributions of the Planck’s dusty GEMS. Blue triangles show the velocity-integrated line fluxes uncorrected for gravitational magnification, as measured in this work with EMIR on the IRAM 30-m telescope. All CO(1–0) fluxes are taken from Harrington et al. (2018, black triangles) and CO(3–2) for PLCK_G092.5+42.9 is from Harrington et al. (2016). For PLCK_G045.1+61.1, PLCK_G092.5+42.9, and PLCK_G244.8+54.9, light blue and red triangles show the SLEDs obtained for the blue and red kinematic components, respectively, for the transitions with S/N values sufficiently high to obtain a robust separation of the two components.
Current usage metrics show cumulative count of Article Views (full-text article views including HTML views, PDF and ePub downloads, according to the available data) and Abstracts Views on Vision4Press platform.
Data correspond to usage on the plateform after 2015. The current usage metrics is available 48-96 hours after online publication and is updated daily on week days.
Initial download of the metrics may take a while.